Fig. D.2.
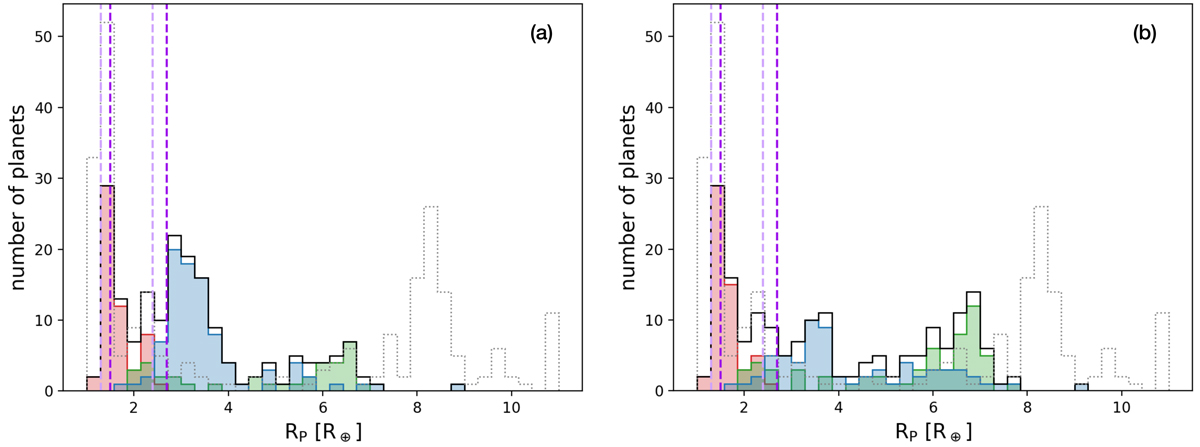
Size distribution of the synthetic planets after undergoing one giant impact and photoevaporation. Left panel: maximum mass removed by the collision. Right panel: mean mass removed by the collision. Red: fice, f < 5%, green: 5%≤fice, f < 45%, blue: fice, f ≥ 45%, where fice, f is the final mass fraction of water relative to the total amount of heavy elements. Black lines: overall size distribution. Grey dotted lines: distribution without colissions (as in Fig. 4). Vertical dashed lines: peaks of the Kepler size distribution inferred by Fulton et al. (2017) (light violet) and Martinez et al. (2019) (dark violet).
Current usage metrics show cumulative count of Article Views (full-text article views including HTML views, PDF and ePub downloads, according to the available data) and Abstracts Views on Vision4Press platform.
Data correspond to usage on the plateform after 2015. The current usage metrics is available 48-96 hours after online publication and is updated daily on week days.
Initial download of the metrics may take a while.