Fig. 5
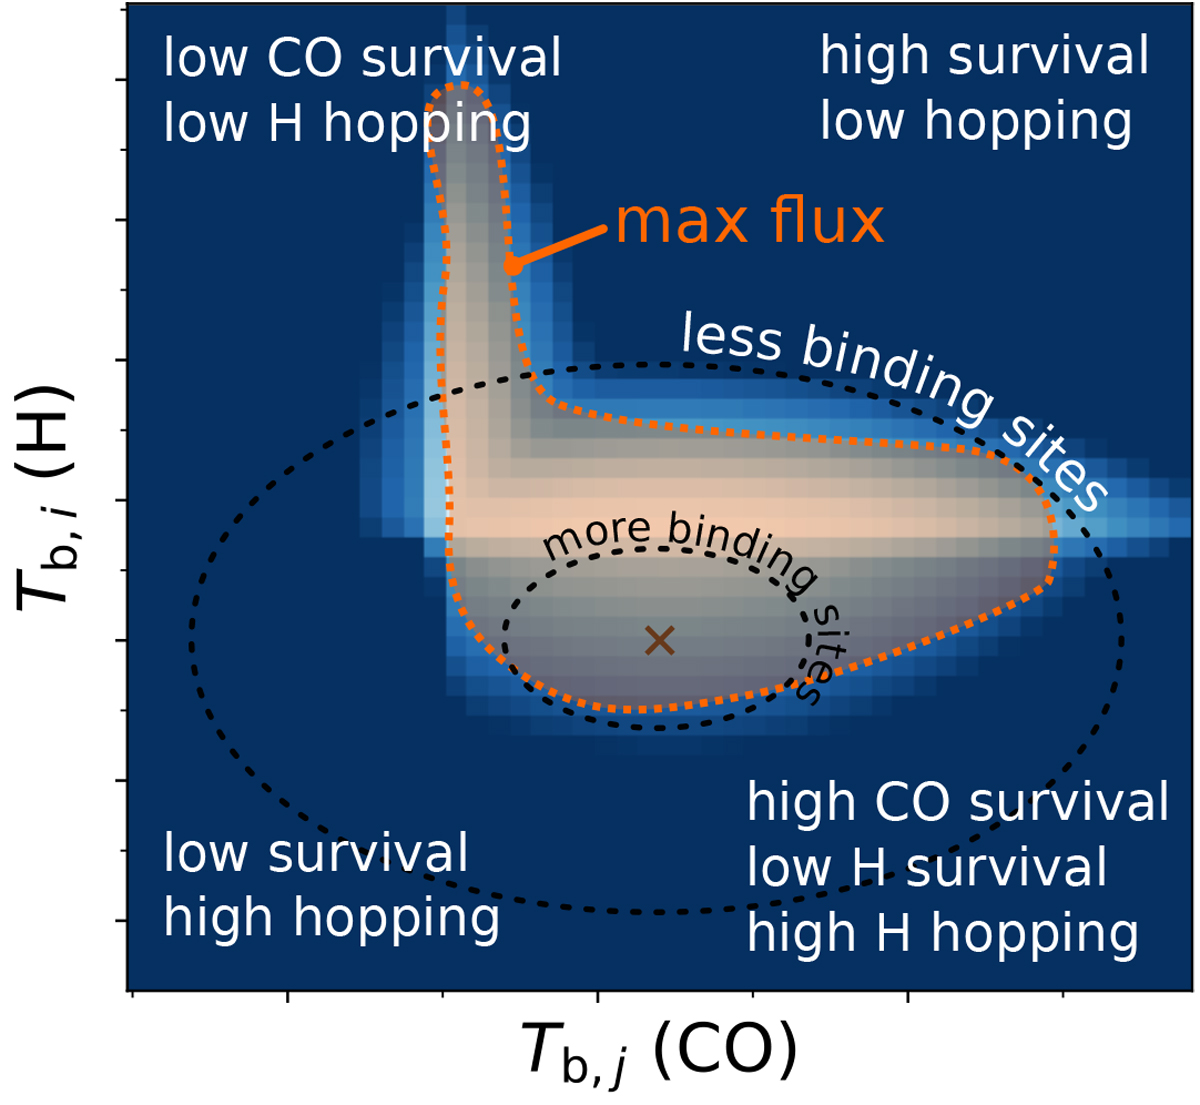
Schematic representation of upper-right panel of Fig. 4, but also applicable to the other panels. Labels indicate the specific conditions that characterise the flux in those regions. Dashed circular lines represent the reduction of available binding sites due to the Gaussian shape of their distribution. The orange shaded area is where the flux is maximised, due to the interplay of the above conditions.
Current usage metrics show cumulative count of Article Views (full-text article views including HTML views, PDF and ePub downloads, according to the available data) and Abstracts Views on Vision4Press platform.
Data correspond to usage on the plateform after 2015. The current usage metrics is available 48-96 hours after online publication and is updated daily on week days.
Initial download of the metrics may take a while.