Fig. 3
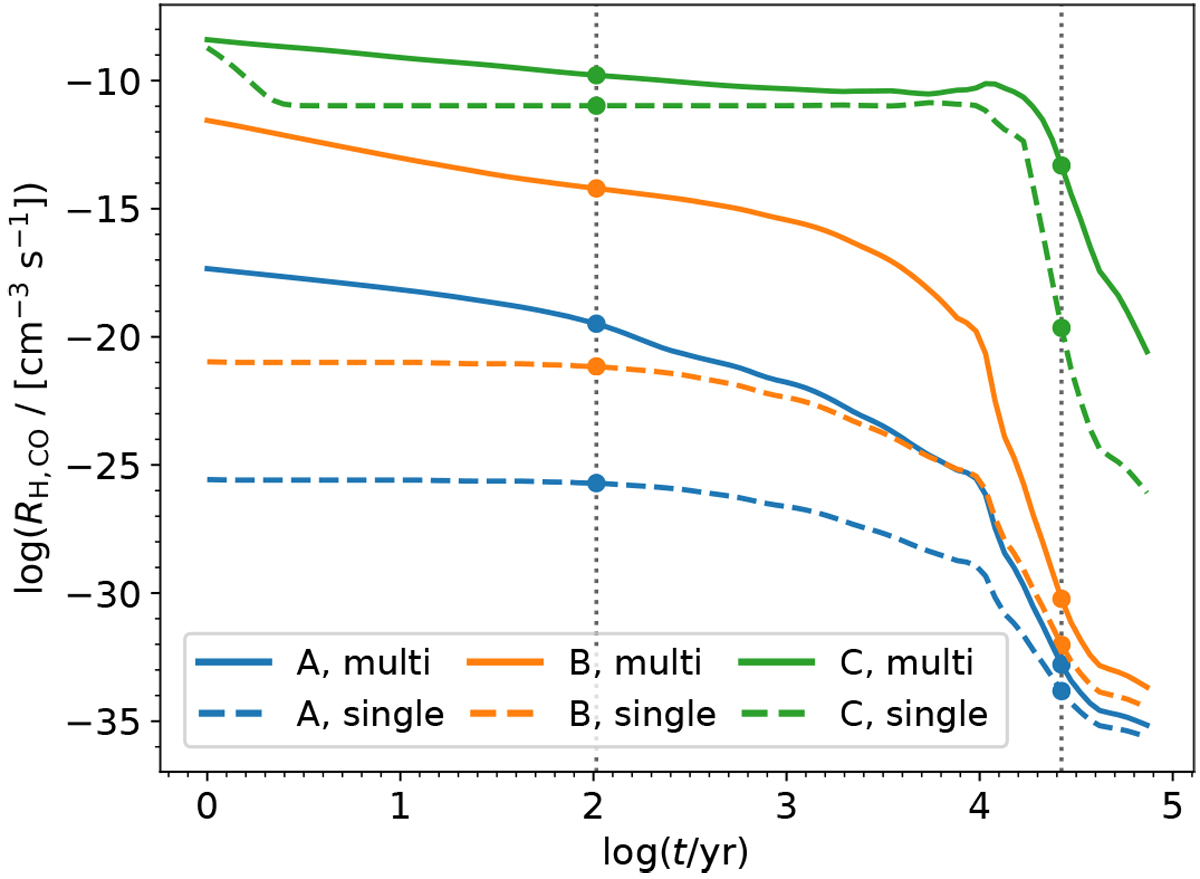
Time evolution of rate RH, CO obtained by summing the rates of the reactions that involve the individual bins with different binding energies, as defined in Eq. (27). We note the decline of the rates with time, given by the increasing Td that evaporates more and more reactants from the surface of the grains. The models are A (blue), B (orange), and C (green), as indicated in Fig. 2, while solid and dashed lines indicate multiple- and single-bin approaches, respectively.The vertical dotted lines and the circular markers are the same as in Fig. 2, employed as a reference for Fig. 4.
Current usage metrics show cumulative count of Article Views (full-text article views including HTML views, PDF and ePub downloads, according to the available data) and Abstracts Views on Vision4Press platform.
Data correspond to usage on the plateform after 2015. The current usage metrics is available 48-96 hours after online publication and is updated daily on week days.
Initial download of the metrics may take a while.