Fig. 2
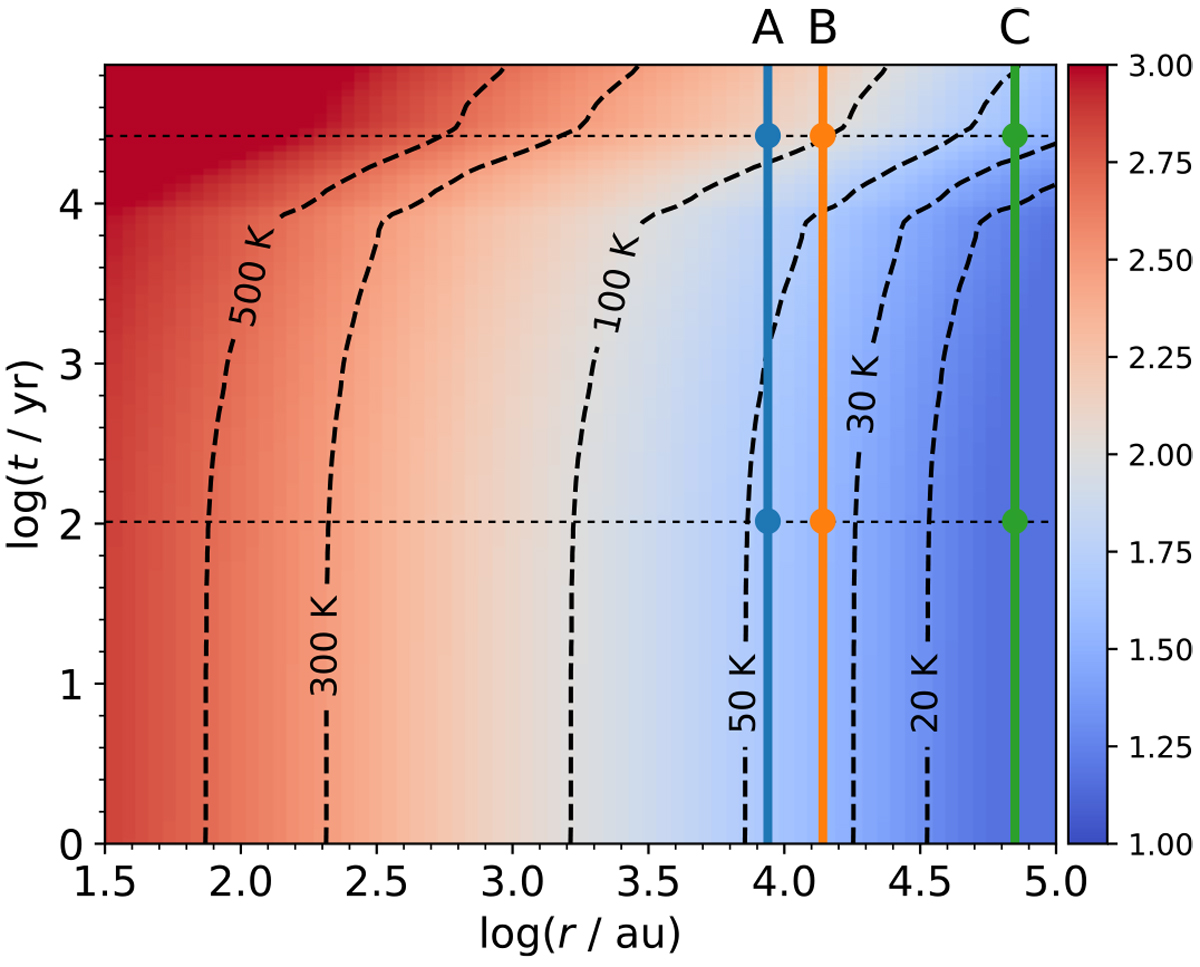
Temperature map as a function of r and t of the physical model calculated with the radiative transfer code MOCASSIN, assuming T = Td, and where the colour bar reports log(T). The chemical network is evolved in time at each radius, varying the dust and the gas temperature according to this model, while density is a function of r only. We selected three models at three specific radii (marked A, B, and C) to discuss the impact of the multiple binding energy approach, see Fig. 3. At these radii, we further discuss the distribution of the chemical abundances at specific (r, t) combinations, indicated by the circular markers and by the horizontal dashed lines (see Fig. 4). The inner (r ≲ 3 × 10³ au) high-temperature region of the envelope is less relevant for the overall discussion, given the relatively short evaporation timescale, and for this reason it is ignored in our discussion.
Current usage metrics show cumulative count of Article Views (full-text article views including HTML views, PDF and ePub downloads, according to the available data) and Abstracts Views on Vision4Press platform.
Data correspond to usage on the plateform after 2015. The current usage metrics is available 48-96 hours after online publication and is updated daily on week days.
Initial download of the metrics may take a while.