Free Access
Fig. 9.
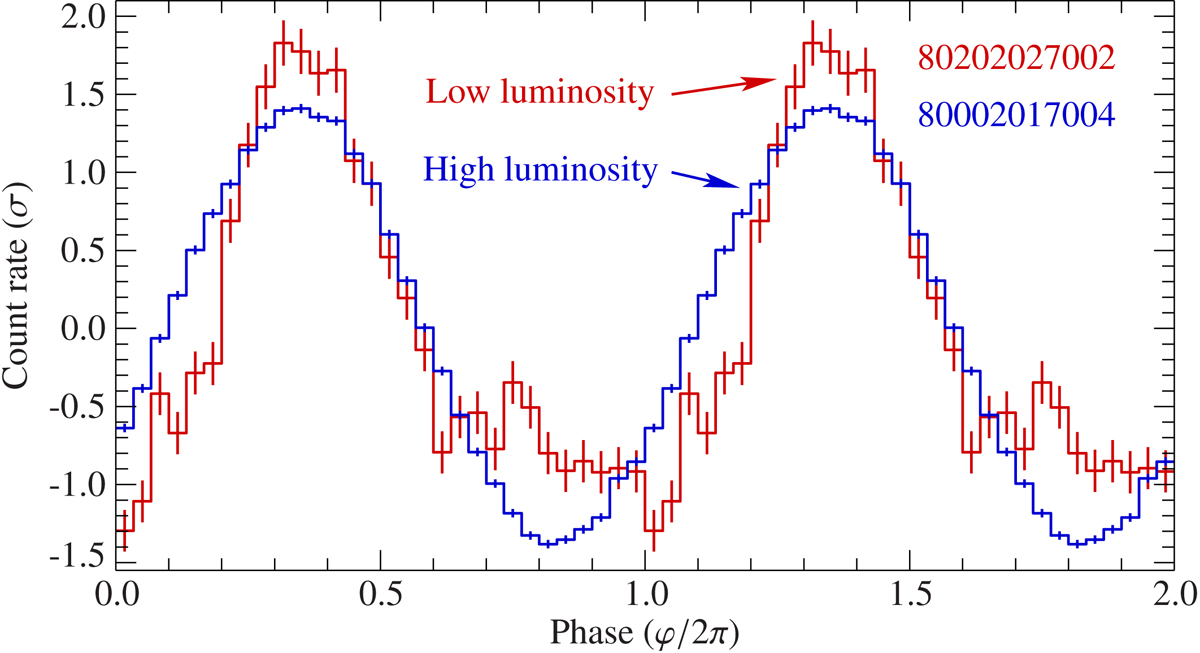
NuSTAR pulse profiles of this observation (red) taken at a luminosity of 3.2 × 1036 erg s−1 (3−50 keV) and the 2014 outburst (blue) at 1.9 × 1038 erg s−1 (0.5−10 keV, Younes et al. 2015). The pulse profile of this observation is narrower, less sinusoidal and shows the indication of a secondary peak at late phases.
Current usage metrics show cumulative count of Article Views (full-text article views including HTML views, PDF and ePub downloads, according to the available data) and Abstracts Views on Vision4Press platform.
Data correspond to usage on the plateform after 2015. The current usage metrics is available 48-96 hours after online publication and is updated daily on week days.
Initial download of the metrics may take a while.