Free Access
Fig. 7.
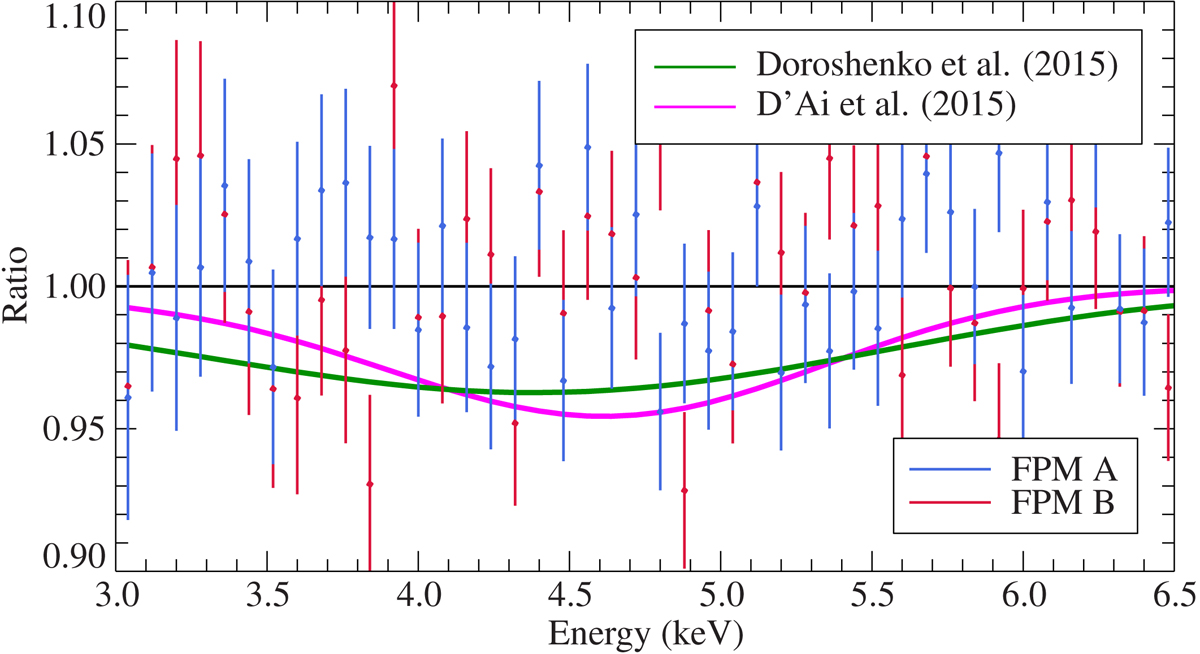
Ratio of NuSTAR data and fit model without gabs as a function of energy in the band where a CRSF was observed in earlier data. The green and pink lines show the CRSF parameters claimed in earlier analyses. CRSFs with these strengths would have likely been seen in the present data data.
Current usage metrics show cumulative count of Article Views (full-text article views including HTML views, PDF and ePub downloads, according to the available data) and Abstracts Views on Vision4Press platform.
Data correspond to usage on the plateform after 2015. The current usage metrics is available 48-96 hours after online publication and is updated daily on week days.
Initial download of the metrics may take a while.