Fig. 4.
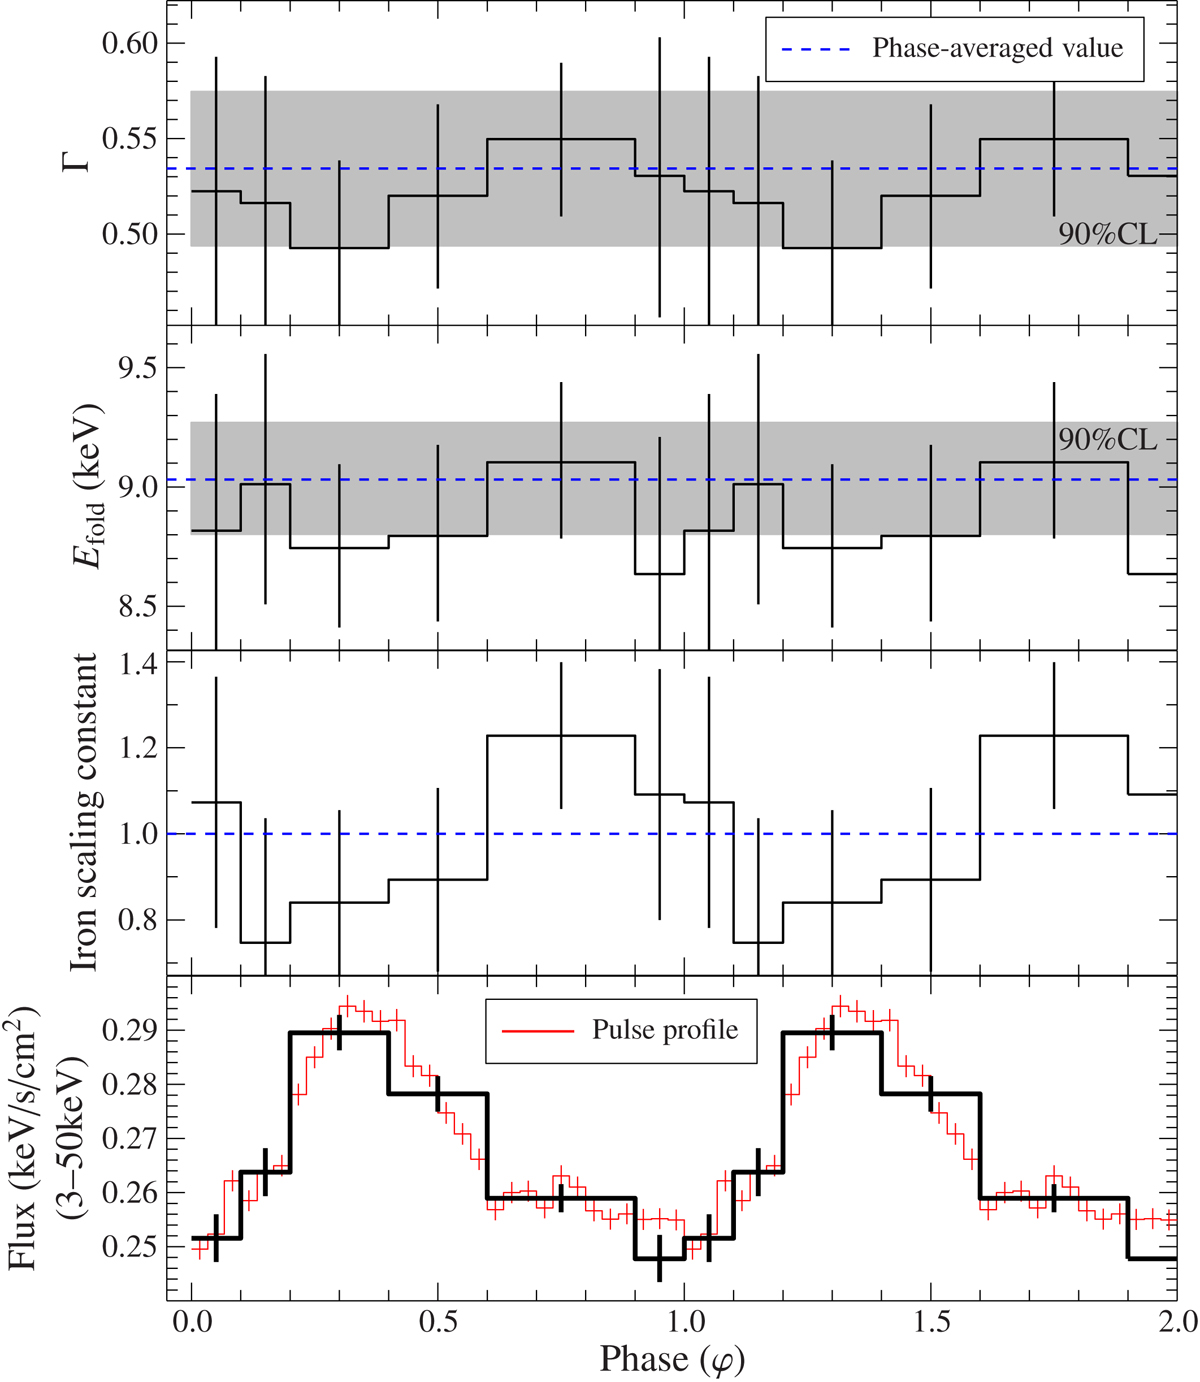
Phase-resolved continuum parameters of the fit model. The blue dashed line gives the phase-averaged values at the 90% confidence level (shaded). The FPM A and FPM B cross-calibration constant 0.965 and the column density 6.35 × 1022 cm−2 are fixed to the phase-averaged best-fit values. The “iron scaling constant” shows the variation in the relative strength of the iron line complex, whose parameters have been otherwise fixed to the phase-averaged values. No significant changes can be identified in the continuum parameters. Lowest panel: we plot the (re-scaled) pulse profile. Errors are at the 90% confidence level.
Current usage metrics show cumulative count of Article Views (full-text article views including HTML views, PDF and ePub downloads, according to the available data) and Abstracts Views on Vision4Press platform.
Data correspond to usage on the plateform after 2015. The current usage metrics is available 48-96 hours after online publication and is updated daily on week days.
Initial download of the metrics may take a while.