Fig. 3.
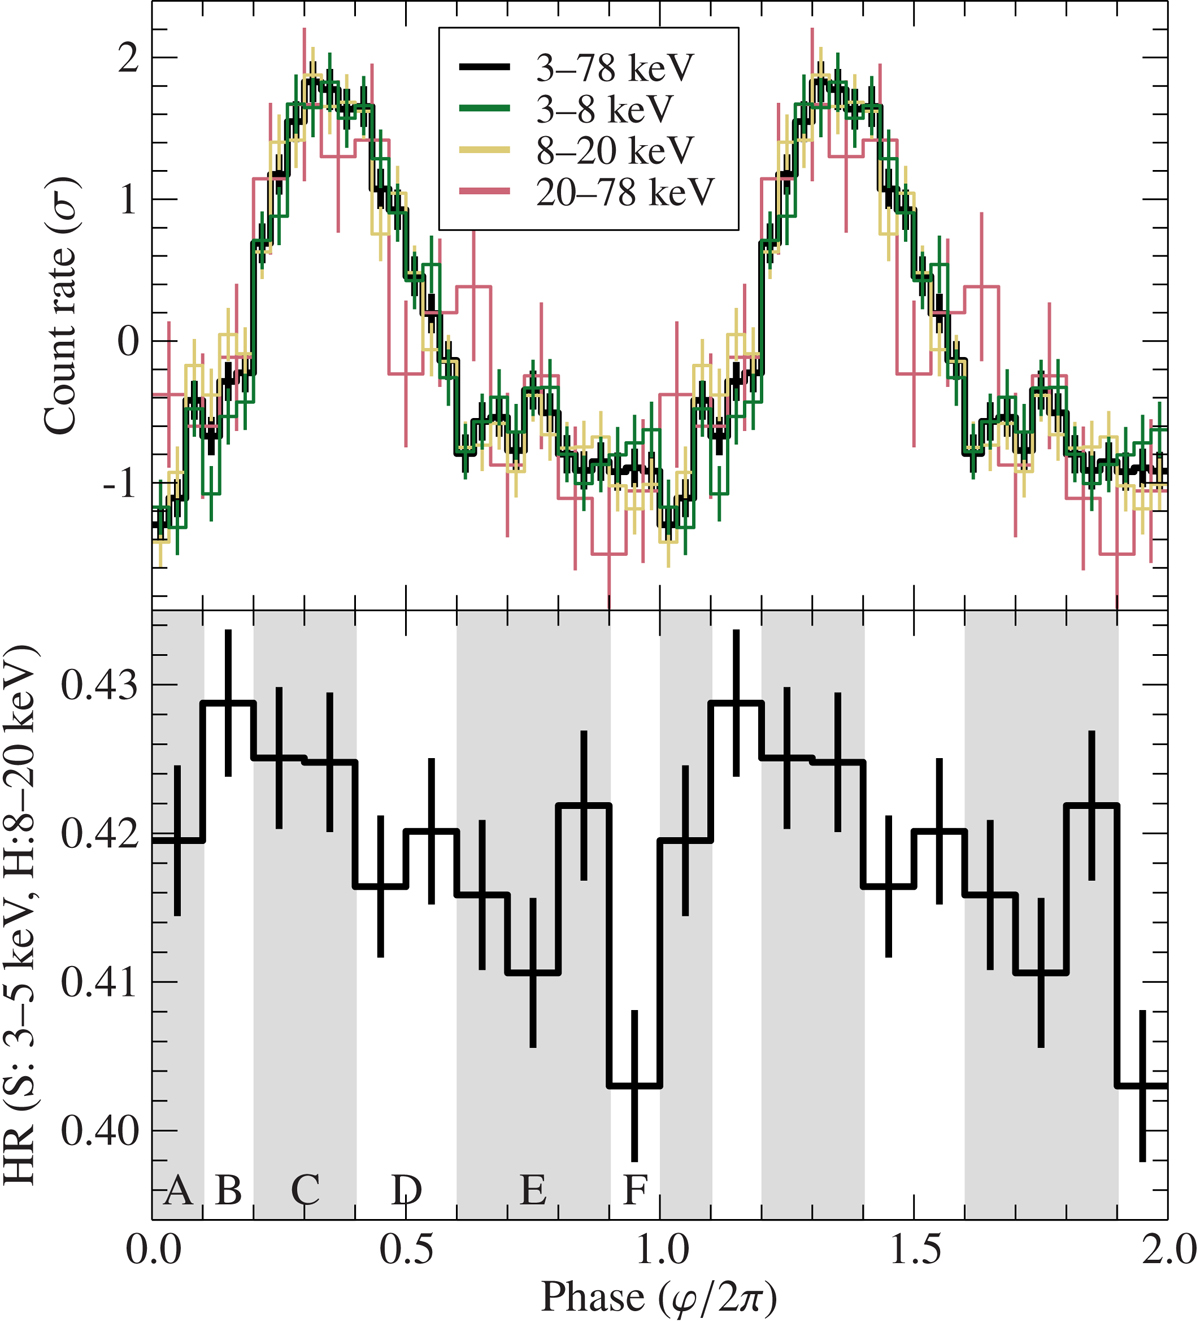
Top: background-subtracted and GTI-corrected pulse profile of GRO J1744–28 for the 3−78 keV band (black) and for three narrower energy bands (colored). The count rate is normalized by subtracting the mean and dividing by the standard deviation to emphasize potential changes in the shape of the profile. The 20−78 keV band is binned more coarsely for visualization purposes. No significant energy dependence can be seen (see text). Bottom: variation in the hardness ratio with phase (combined data from FPM A and B). The vertical bands show the phase ranges chosen for phase-resolved spectroscopy.
Current usage metrics show cumulative count of Article Views (full-text article views including HTML views, PDF and ePub downloads, according to the available data) and Abstracts Views on Vision4Press platform.
Data correspond to usage on the plateform after 2015. The current usage metrics is available 48-96 hours after online publication and is updated daily on week days.
Initial download of the metrics may take a while.