Fig. 2.
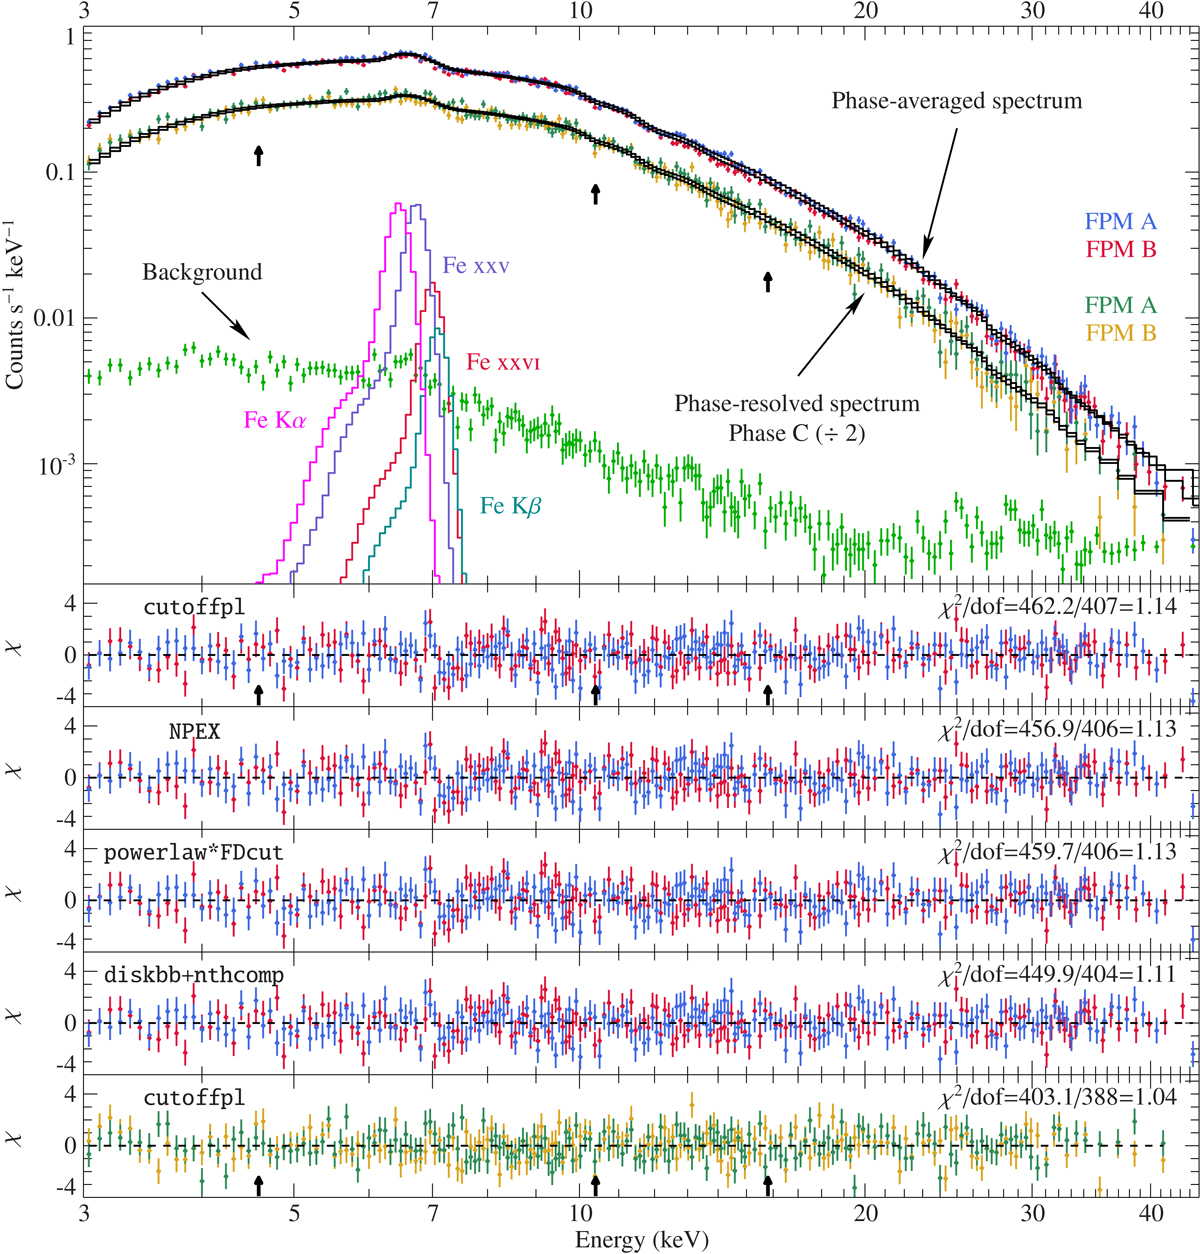
Phase-averaged spectrum and one phase-resolved spectrum (phase C, as defined in Fig. 3, displaced by factor of 2 for visualization). The black histogram gives the best-fitting model: an absorbed cutoff power law with iron component at ∼6.5 keV. Green points show background of FPM A. Arrows indicate the location of the reported CRSFs (Doroshenko et al. 2015; D’Aì et al. 2015). The iron line asymmetry is due to the convolution with the detector response and the logarithmic scale. All tested continuum models describe the data comparably well.
Current usage metrics show cumulative count of Article Views (full-text article views including HTML views, PDF and ePub downloads, according to the available data) and Abstracts Views on Vision4Press platform.
Data correspond to usage on the plateform after 2015. The current usage metrics is available 48-96 hours after online publication and is updated daily on week days.
Initial download of the metrics may take a while.