Free Access
Fig. 1.
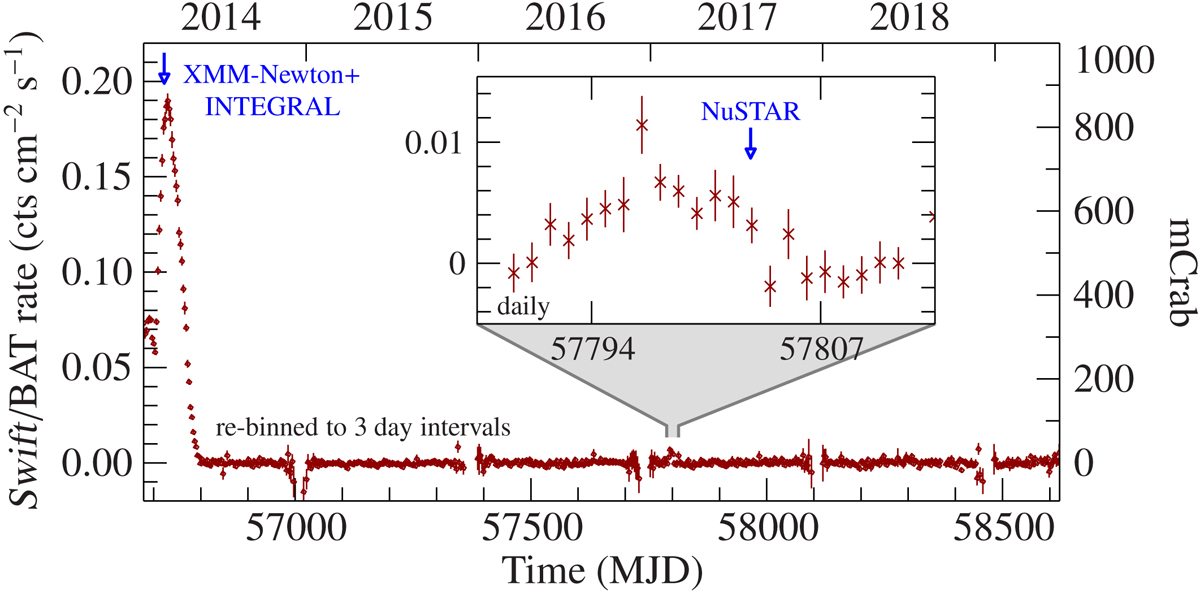
Swift/BAT light curve of GRO J1744–28. The outburst in 2014 had a peak luminosity of 2.1 × 1038 erg s−1, slightly above the Eddington limit (D’Aì et al. 2015). The outburst in 2017 is at much lower luminosity 3.2 × 1036 erg s−1 (3−50 keV). The gaps in the Swift/BAT light curve are due to visibility constraints.
Current usage metrics show cumulative count of Article Views (full-text article views including HTML views, PDF and ePub downloads, according to the available data) and Abstracts Views on Vision4Press platform.
Data correspond to usage on the plateform after 2015. The current usage metrics is available 48-96 hours after online publication and is updated daily on week days.
Initial download of the metrics may take a while.