Free Access
Fig. 8.
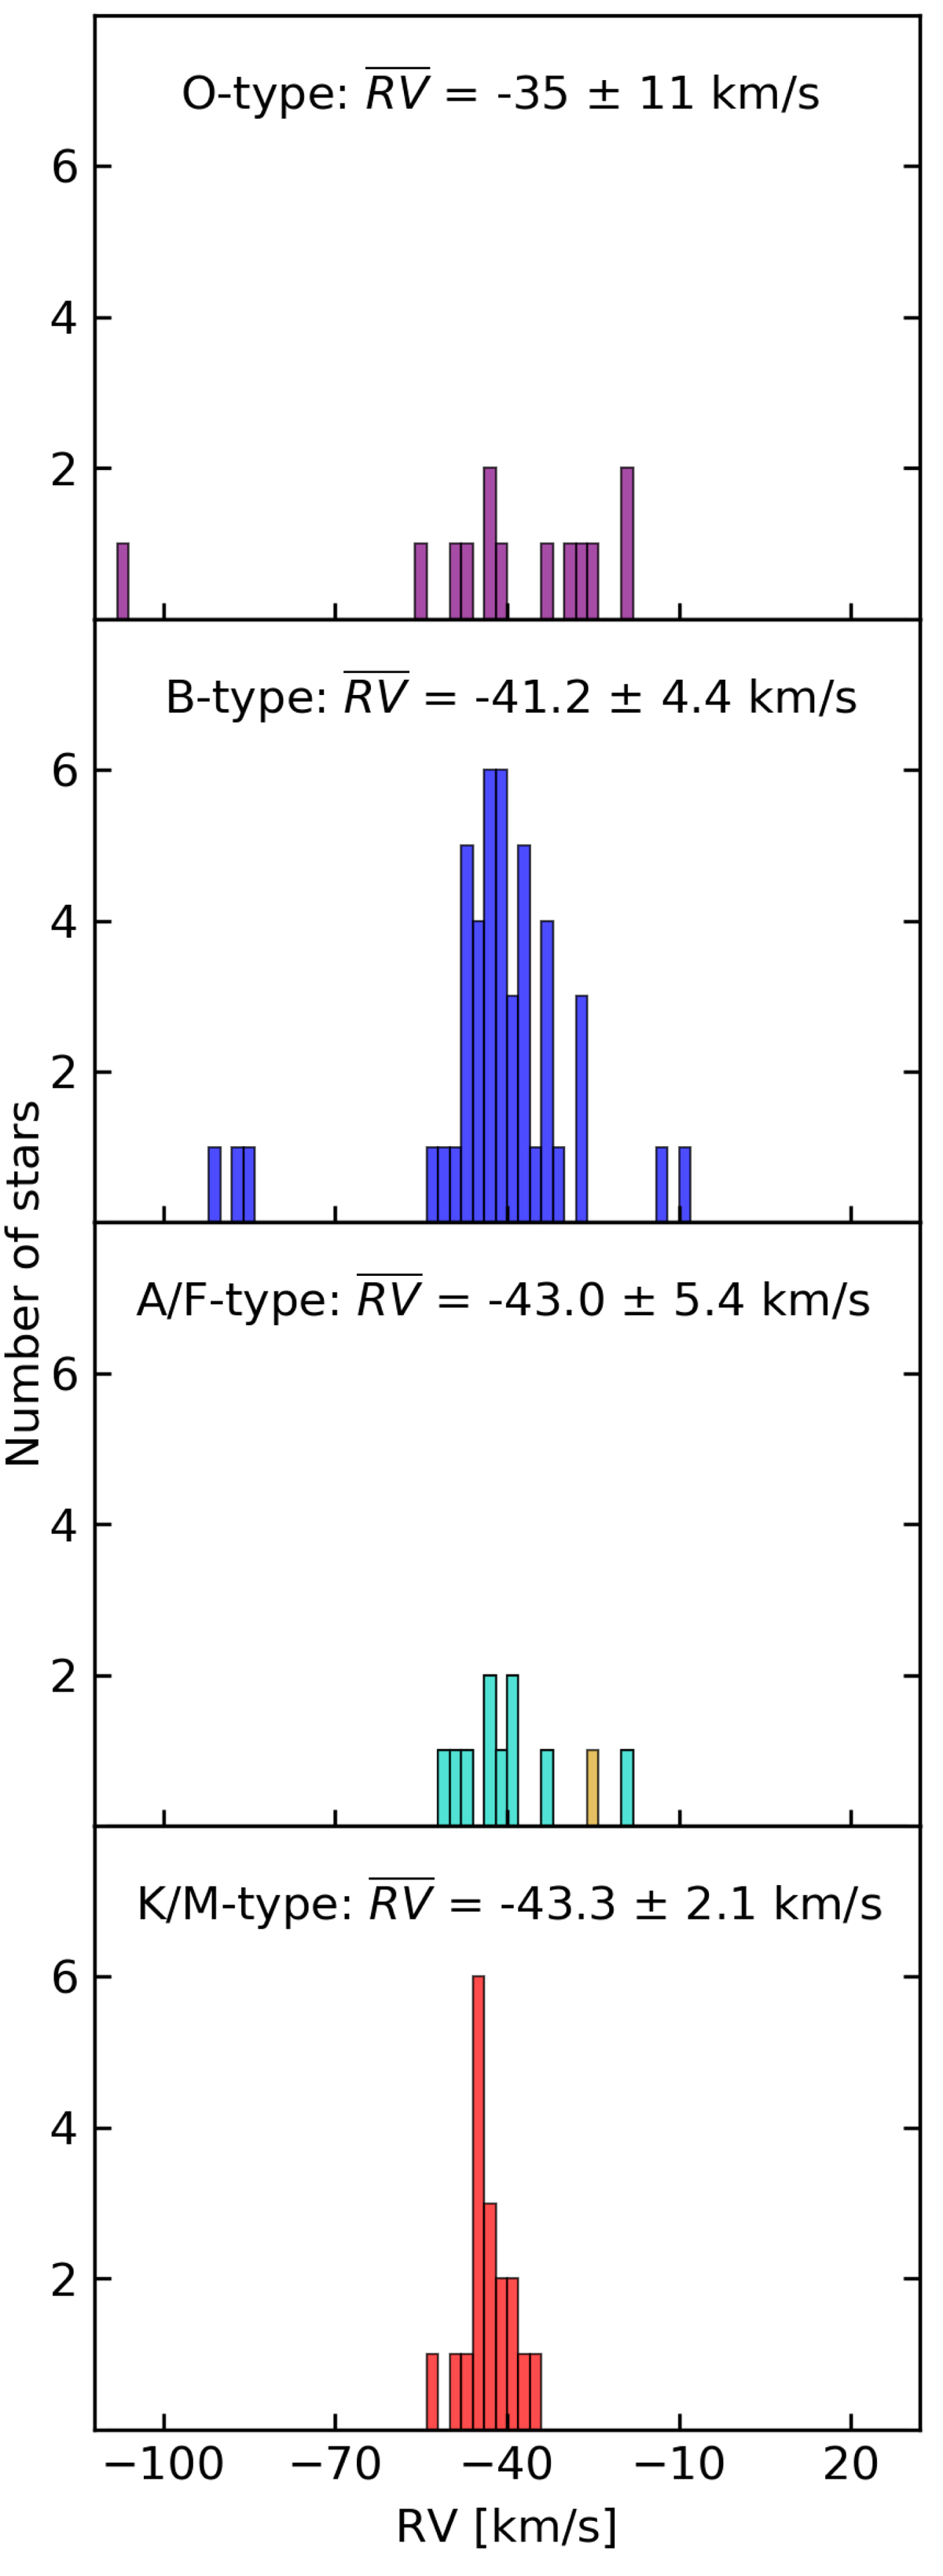
RV distributions associated with the different SpT groups resulting from the analysis of the best S/N spectra. The orange bin in the second panel from the bottom is HD 12842, the F Sg.
Current usage metrics show cumulative count of Article Views (full-text article views including HTML views, PDF and ePub downloads, according to the available data) and Abstracts Views on Vision4Press platform.
Data correspond to usage on the plateform after 2015. The current usage metrics is available 48-96 hours after online publication and is updated daily on week days.
Initial download of the metrics may take a while.