Fig. 7.
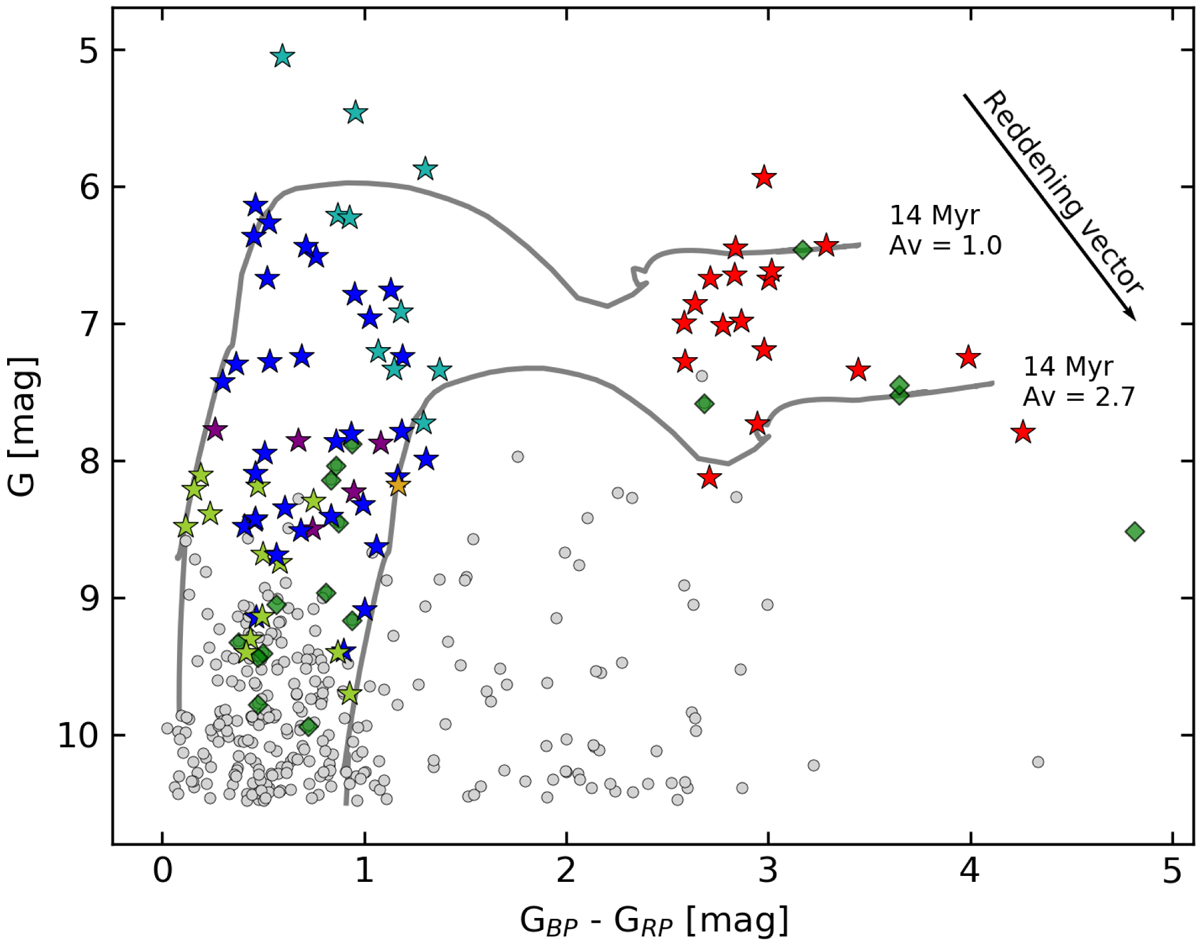
Color-magnitude diagram (using Gaia photometry) of stars located within 4.5 degrees from the center of the Per OB1 association. Colored stars shows the stars in our sample, gray circles represent the remaining stars from Gaia, green diamonds show 17 blue and red supergiants quoted in the literature for which we lack spectra (see the last part of Table A.1). Two isochrones and a reddening vector are also included for reference purposes. See Sect. 4.3 for explanation.
Current usage metrics show cumulative count of Article Views (full-text article views including HTML views, PDF and ePub downloads, according to the available data) and Abstracts Views on Vision4Press platform.
Data correspond to usage on the plateform after 2015. The current usage metrics is available 48-96 hours after online publication and is updated daily on week days.
Initial download of the metrics may take a while.