Fig. 5.
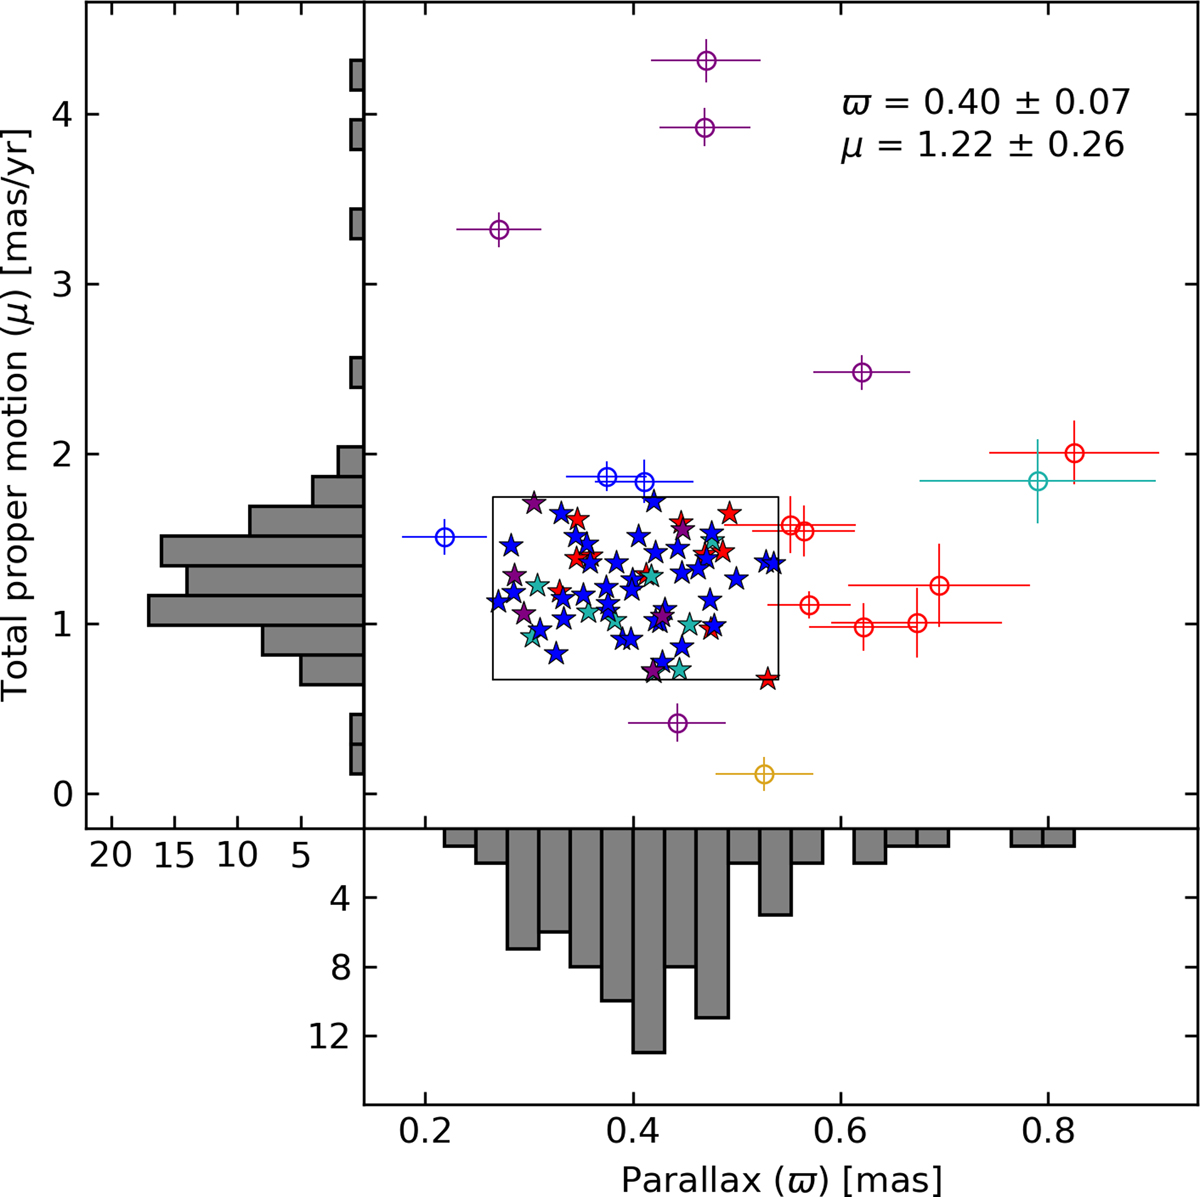
Total proper motions against parallax for the sample of stars except for those labeled “unreliable astrometry” (see Sect. 2.3). The 2σ boundaries of the distribution are shown as a rectangle. Empty colored circles show outliers of the distribution of any of the two quantities, and the associated uncertainties are overplotted. The mean and standard deviation obtained from the stars within the 2σ box are shown in the top right corner.
Current usage metrics show cumulative count of Article Views (full-text article views including HTML views, PDF and ePub downloads, according to the available data) and Abstracts Views on Vision4Press platform.
Data correspond to usage on the plateform after 2015. The current usage metrics is available 48-96 hours after online publication and is updated daily on week days.
Initial download of the metrics may take a while.