Fig. 4.
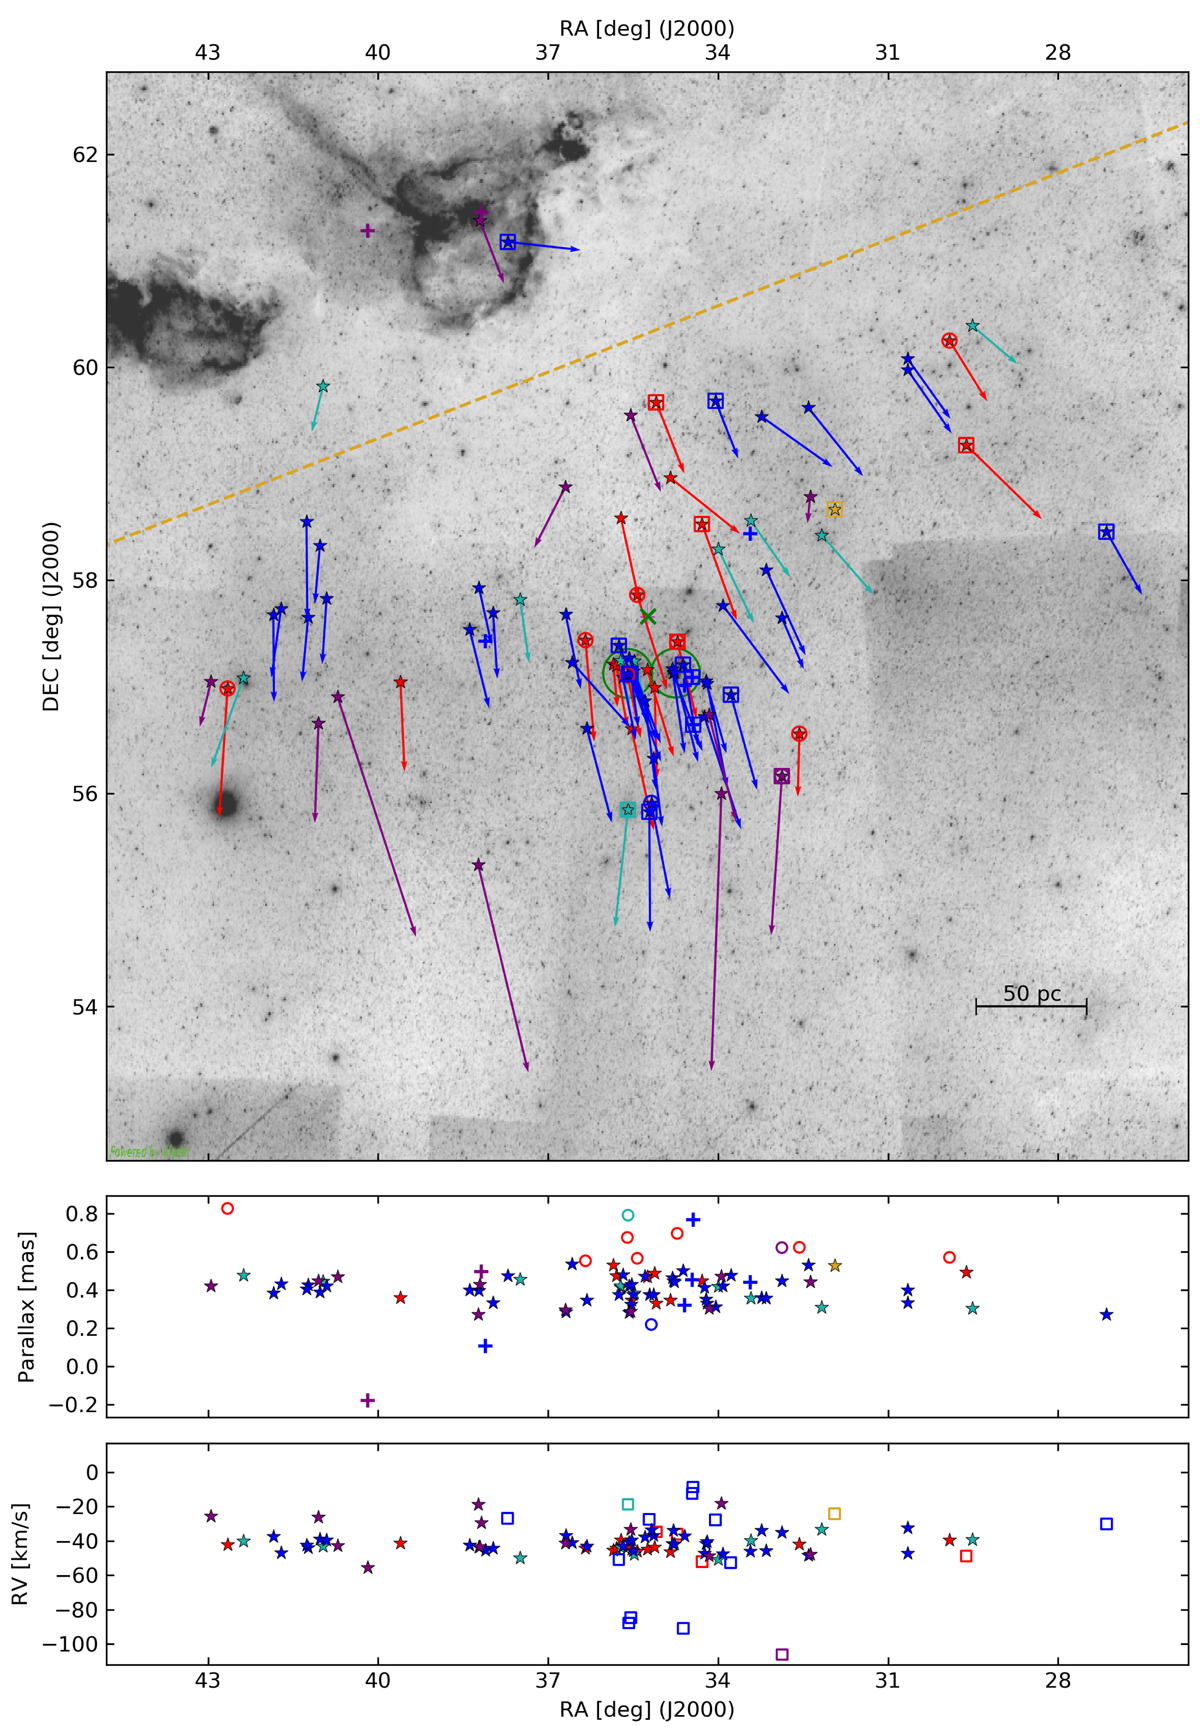
Top panel: sky map of all the stars in the sample overplotted over a DSS-red image of the region. Dashed yellow line indicates the galactic plane, and the central green cross marks the center of Per OB1 (as defined in Mel’nik & Dambis 2017). Green circles indicated the location of the h and χ Persei double cluster. Colored vectors indicate the individual proper motion of each star. Middle and bottom panels: parallax and RV of the spectrum with the highest S/N, respectively, for each star in the sample against their position in right ascension. Open circles and square symbols indicate stars that deviate more than 2σ from the mean of the distribution of parallaxes and RVs, respectively (see Sects. 4.1 and 4.4.1). Stars with bad astrometry (see Sect. 2.3) are indicated with a plus, and no proper motion vectors are overplotted.
Current usage metrics show cumulative count of Article Views (full-text article views including HTML views, PDF and ePub downloads, according to the available data) and Abstracts Views on Vision4Press platform.
Data correspond to usage on the plateform after 2015. The current usage metrics is available 48-96 hours after online publication and is updated daily on week days.
Initial download of the metrics may take a while.