Fig. 1.
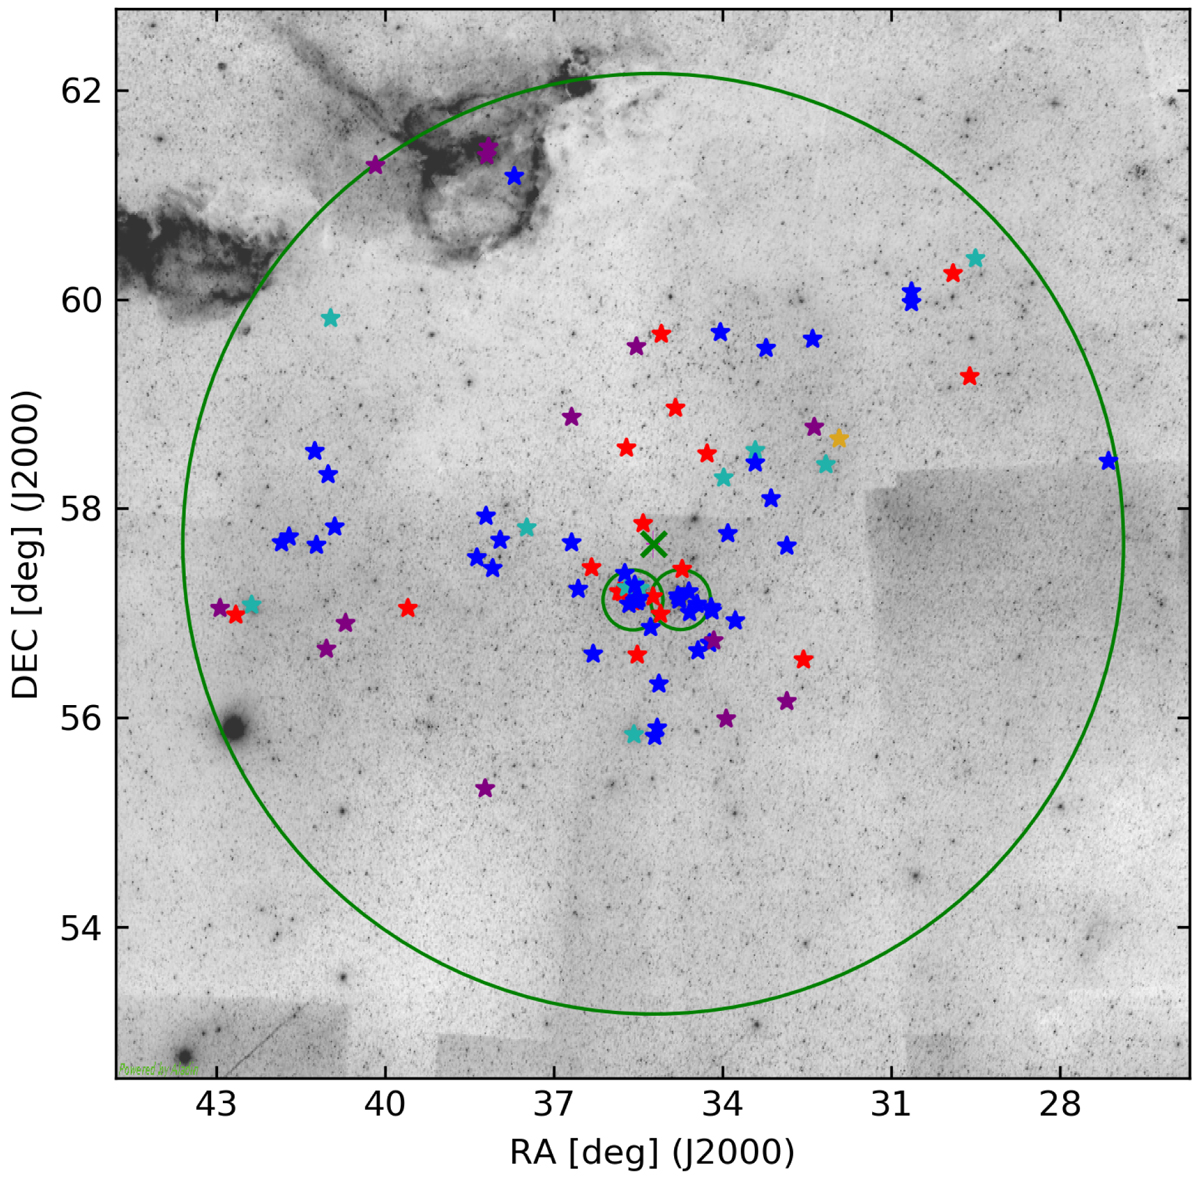
Sky map with the complete sample of stars. Purple, blue, cyan, golden, and red symbols represent the O-, B-, A-, F-, and K- and M-type stars, respectively. This color code is the same in all the plots unless otherwise specified. The central green cross denotes the center of the Per OB1 association taken from Mel’nik & Dambis (2017). The large green circle indicates a 4.5-degree circle around the center. The small green circles show the positions of h and χ Persei. The background image, used for reference, was taken from DSS-red.
Current usage metrics show cumulative count of Article Views (full-text article views including HTML views, PDF and ePub downloads, according to the available data) and Abstracts Views on Vision4Press platform.
Data correspond to usage on the plateform after 2015. The current usage metrics is available 48-96 hours after online publication and is updated daily on week days.
Initial download of the metrics may take a while.