Fig. 7.
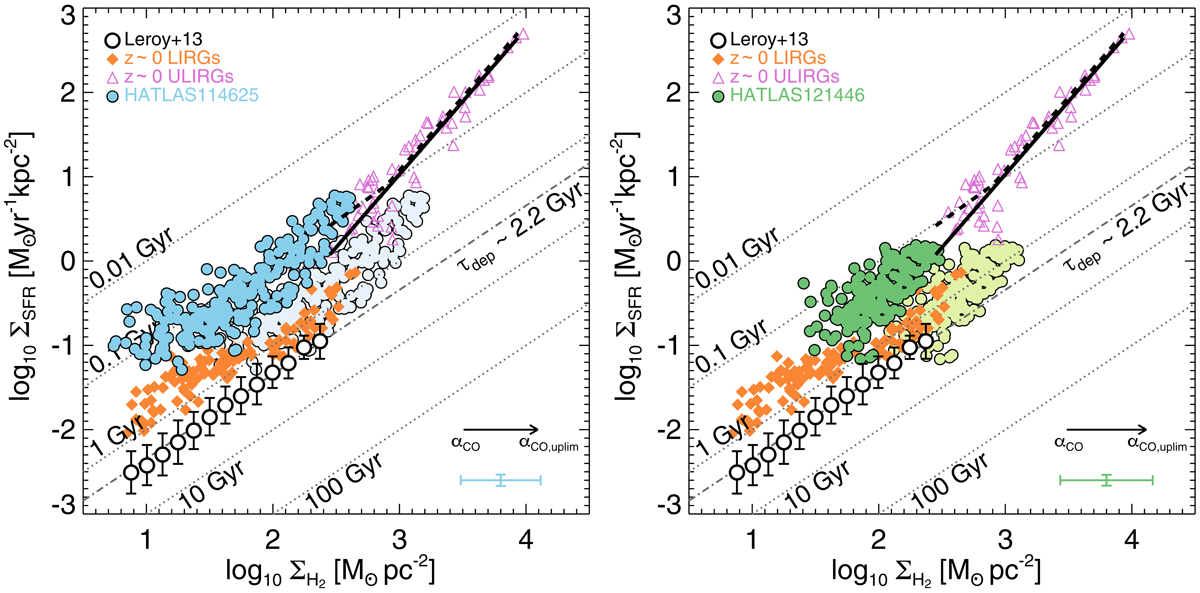
ΣSFR against ΣH2 for the HATLAS114625 (left) and HATLAS121446 (right) starbursts. In each panel, the errorbar in the bottom-right corner represents the typical 1-σ uncertainty. The arrow indicates the horizontal shift of the data produced if we assume the αCO, uplim value instead of the median αCO estimate to calculate ΣH2. This is also highlighted by the lightly coloured data showed in the background. The dotted lines indicate fixed τdep values. We show ∼kpc-scale spatially resolved observations of two z ∼ 0 LIRGs (orange diamonds, Espada et al. 2018) and the median trend observed for the nearby HERACLES galaxy survey (open circles, Leroy et al. 2013). The dot-dashed line represents the best fit for the HERACLES ∼kpc-scale median values. We also present spatially resolved estimates for local ULIRGs measured at ∼350−650 pc scales (Wilson et al. 2019). In solid and dashed lines, we show the double and single power-law best fits reported by Wilson et al. (2019) for the ULIRG data, respectively. Independent of the αCO value assumed, we find lower τdep values than those measured from local normal SFGs.
Current usage metrics show cumulative count of Article Views (full-text article views including HTML views, PDF and ePub downloads, according to the available data) and Abstracts Views on Vision4Press platform.
Data correspond to usage on the plateform after 2015. The current usage metrics is available 48-96 hours after online publication and is updated daily on week days.
Initial download of the metrics may take a while.