Fig. 6.
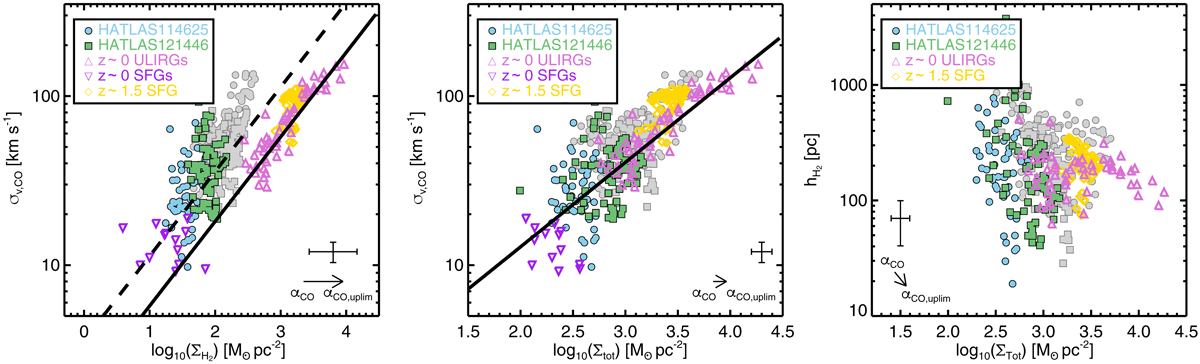
Left: pixel-by-pixel molecular gas velocity dispersion estimates as a function of molecular gas surface density. For each starburst galaxy, in grey, we show the σv, CO values that may be overestimated due to beam-smearing residual effects. The errorbar in the lower-right corner indicates the typical 1-σ uncertainty, whereas the arrow represents the systematic uncertainty given by the use of our αCO upper limit instead of the adopted value. The “z ∼ 0 ULIRG” sample is taken from Wilson et al. (2019). The “z ∼ 0 SFGs” sample estimates are galactic average values measured for a sub-sample of galaxies taken from the CARMA-EDGE survey (Bolatto et al. 2017; Levy et al. 2018). The “z ∼ 1.5 SFG” data correspond to the ∼kpc-scale measurements for a main-sequence galaxy presented in Molina et al. (2019b). The solid line represents the empirical relationship suggested by Wilson et al. (2019). The dashed line shows the empirical relationship corrected by the average ΣH2/ΣTot and Vrot, CO/σv, CO ratios measured for both systems. Middle: pixel-by-pixel σv, CO values as a function of the total surface density. Right: molecular gas scale height as a function of the total gas surface density. The last two panels are colour-coded in the same way as the left panel. The vertical pressure equilibrium model gives a reasonable representation of our data.
Current usage metrics show cumulative count of Article Views (full-text article views including HTML views, PDF and ePub downloads, according to the available data) and Abstracts Views on Vision4Press platform.
Data correspond to usage on the plateform after 2015. The current usage metrics is available 48-96 hours after online publication and is updated daily on week days.
Initial download of the metrics may take a while.