Fig. 5.
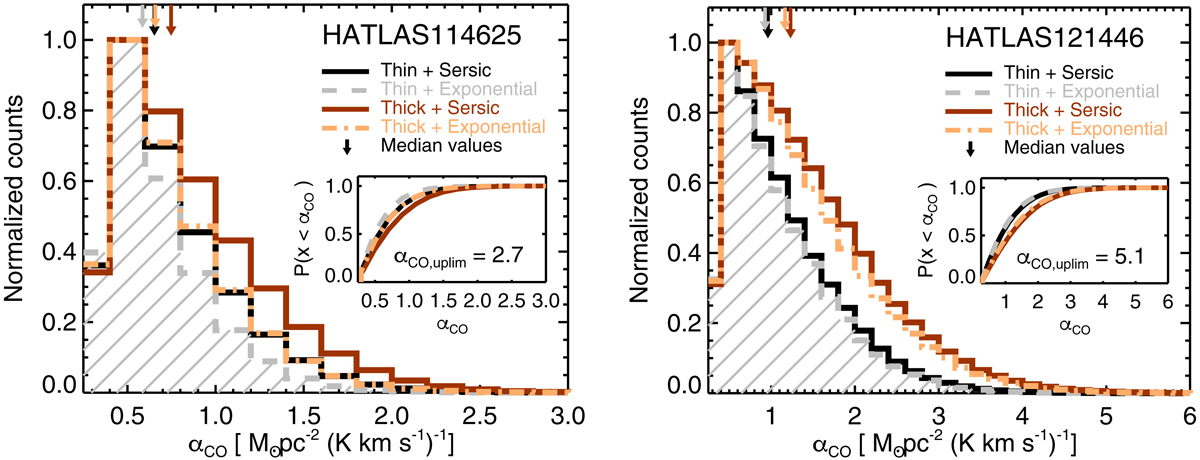
Posterior αCO PDFs for HATLAS114625 (left) and HATLAS121446 (right) starbursts. For each galaxy, we consider four dynamical mass models encompassing different underlying surface density mass distributions and hydrostatic equilibrium approximations. We also show the cumulative probability distribution in each panel with our αCO upper limit defined as P(x < αCO, uplim) ≈ 0.997 (i.e. 3-σ) and estimated by using the thick-disc plus Sérsic dynamical mass model. The coloured arrows indicate the median αCO value for each PDF. We find median αCO estimates consistent with the ULIRG-like value for both starburst galaxies.
Current usage metrics show cumulative count of Article Views (full-text article views including HTML views, PDF and ePub downloads, according to the available data) and Abstracts Views on Vision4Press platform.
Data correspond to usage on the plateform after 2015. The current usage metrics is available 48-96 hours after online publication and is updated daily on week days.
Initial download of the metrics may take a while.