Fig. 4.
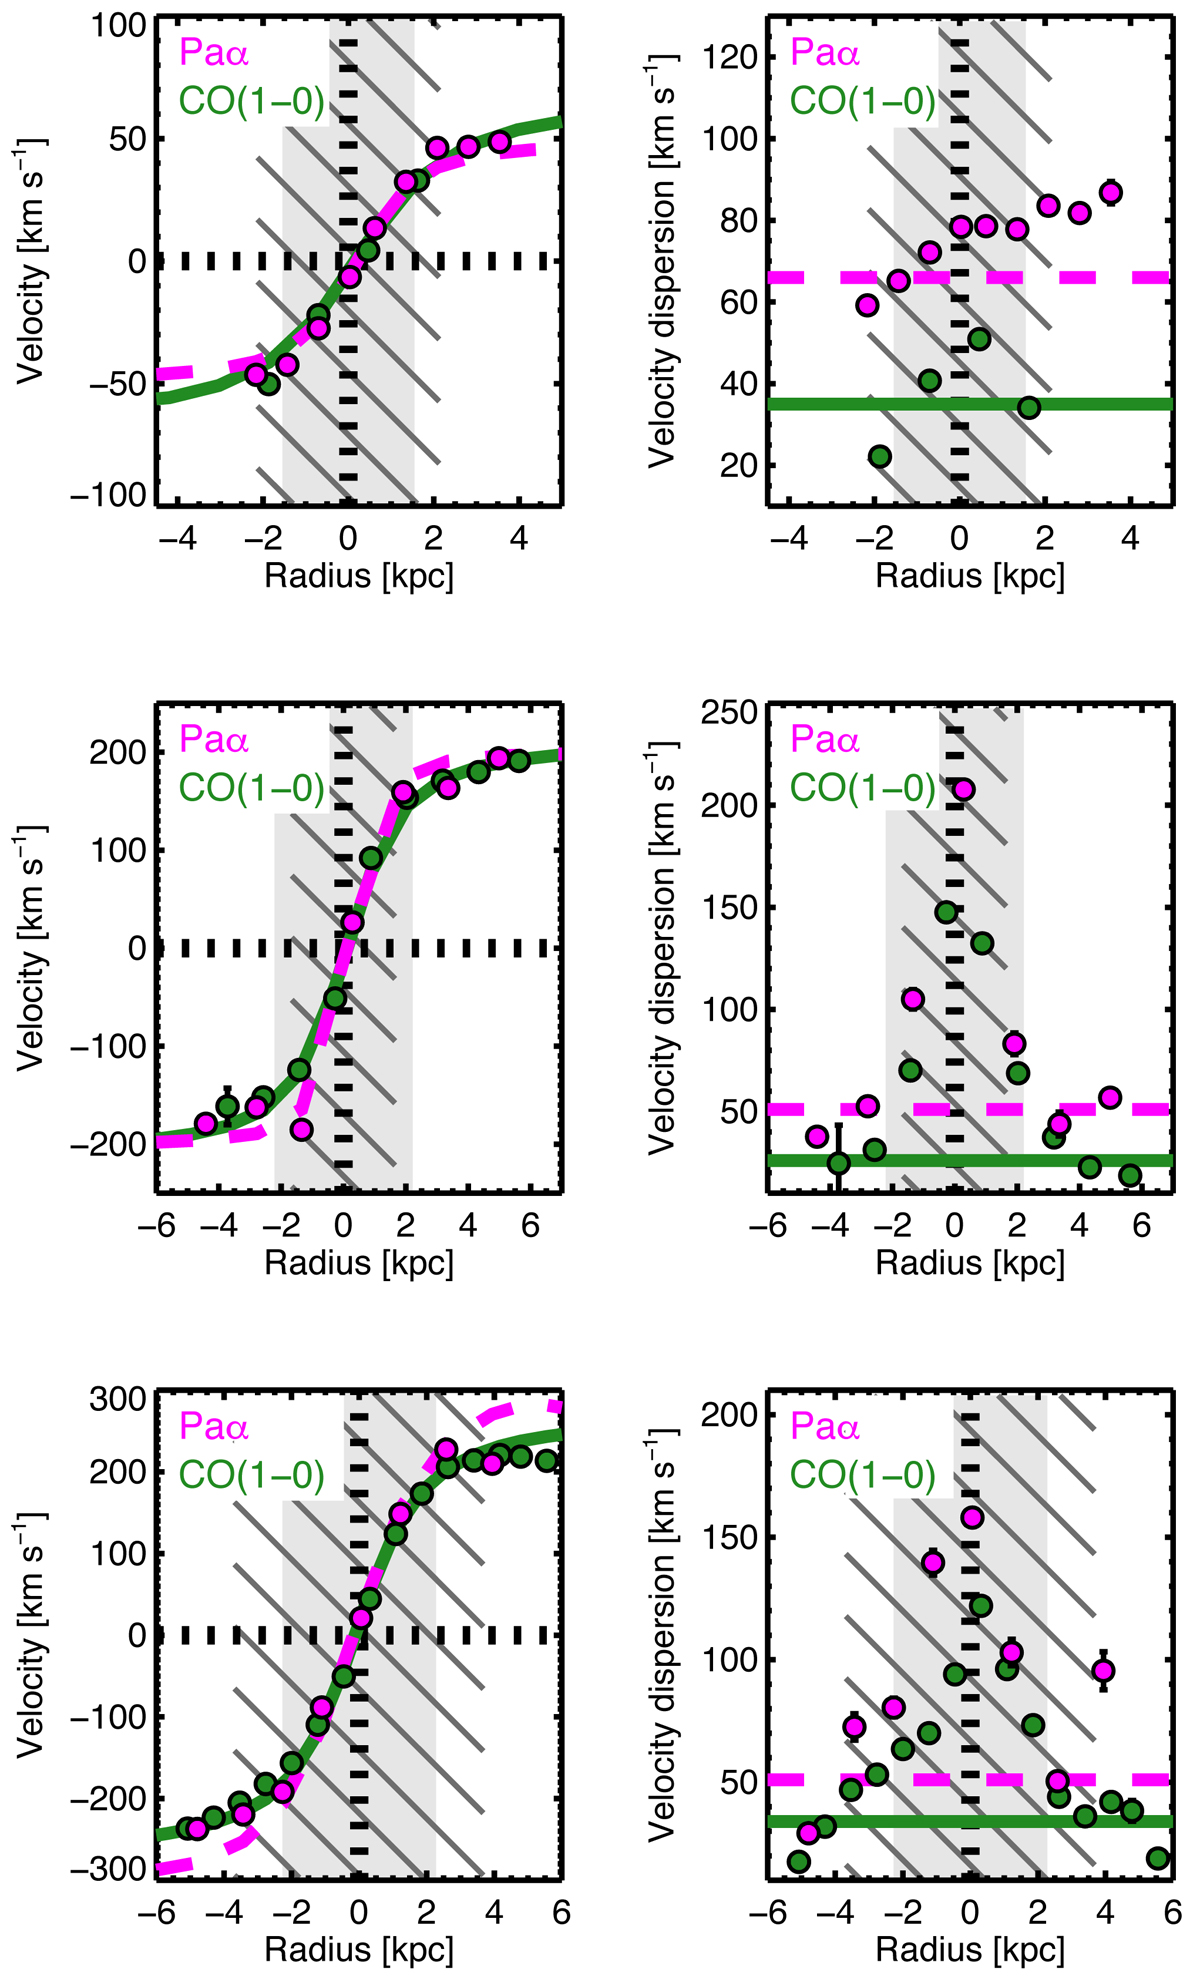
Rotation velocity (left) and velocity dispersion (right) profiles across the major kinematic axis for the HATLAS090750 (top), HATLAS114625 (middle), and HATLAS121446 (bottom) galaxies. The errorbars show the 1-σ uncertainties. The vertical black-dashed line represents the best-fit dynamical centre. The light grey shaded area represents the 3× synthesized beam size region centred at the best-fit molecular gas dynamical centre, whereas the dark grey dashed area represents the 3× PSF FWHM zone centred at the best-fit ionized gas dynamical centre. In the rotation velocity profile panels, the dashed-magenta and solid-green curves show the rotation curves extracted from the beam-smeared Paα and CO(1–0) two-dimensional best-fit models, respectively. In the velocity dispersion profile panels, the green- and magenta-dashed lines show the median galactic value estimated from the outskirts of the galactic disc (Table 4) for the CO(1–0) and Paα observations, respectively. We find a good agreement between the rotation curves derived from the ionized and molecular gas ISM phases in the three starbursts.
Current usage metrics show cumulative count of Article Views (full-text article views including HTML views, PDF and ePub downloads, according to the available data) and Abstracts Views on Vision4Press platform.
Data correspond to usage on the plateform after 2015. The current usage metrics is available 48-96 hours after online publication and is updated daily on week days.
Initial download of the metrics may take a while.