Fig. 3.
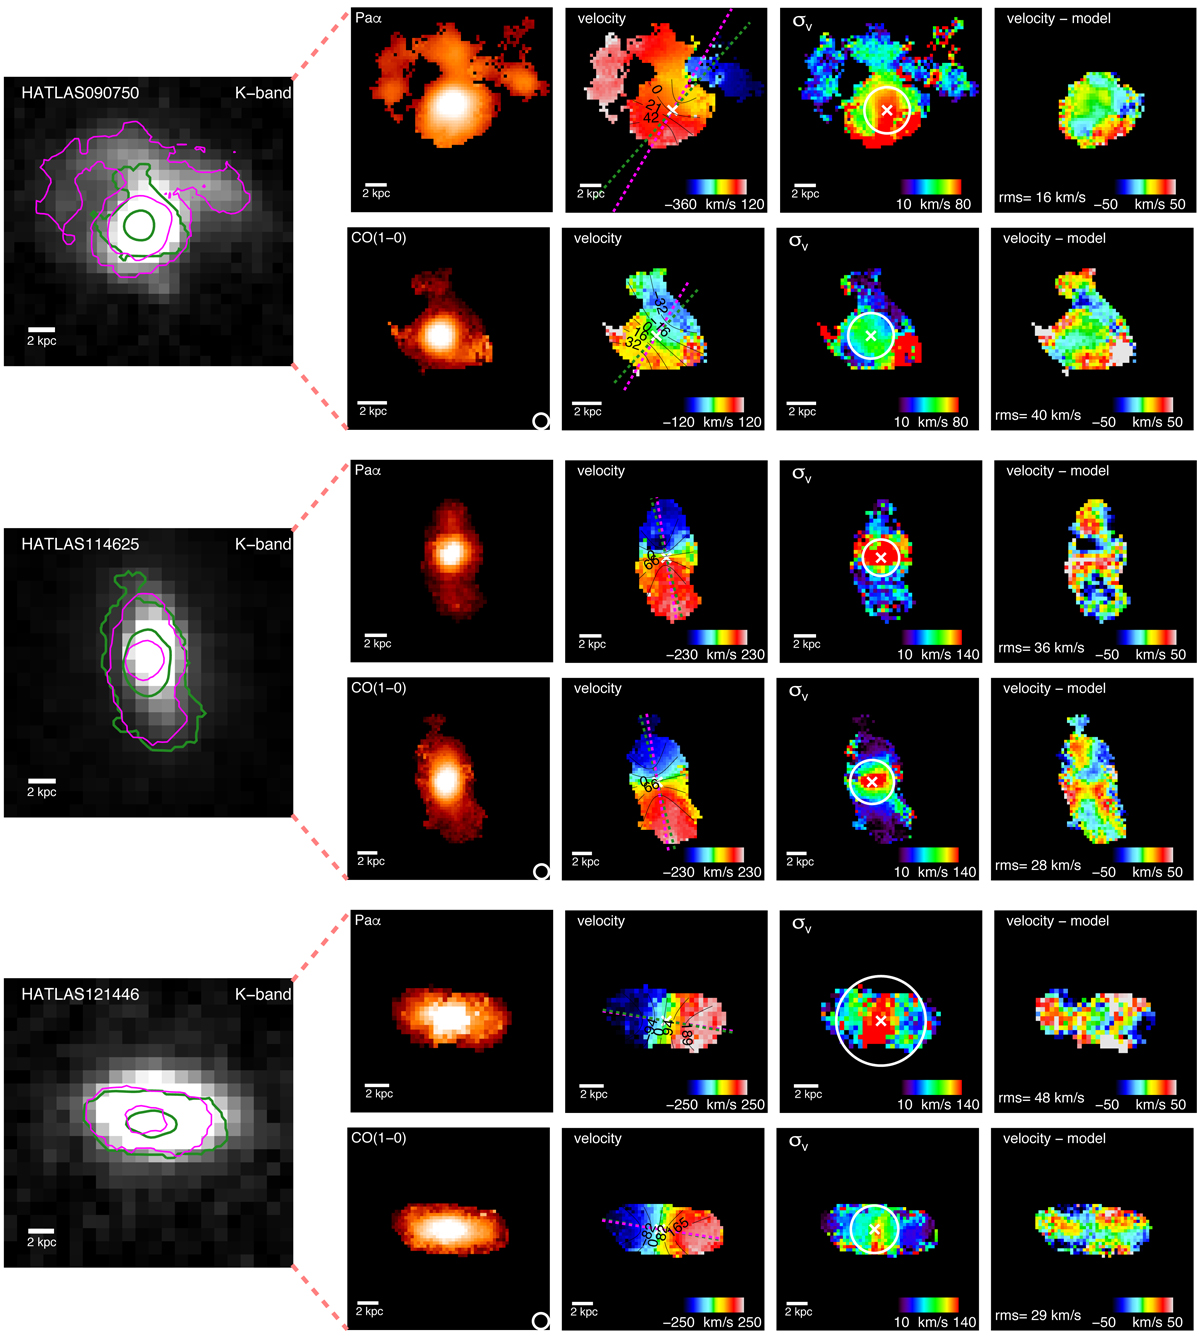
K-band, intensity, velocity, velocity dispersion, and residual maps (first to fifth columns) for HATLAS090750 (top), HATLAS114625 (middle), and HATLAS121446 (bottom). For each galaxy, from the second column to the last column, we show the Paα and CO(1–0) two-dimensional maps, one above the other, respectively. The spatial scale for each observation is shown in each map. The K-band map has the CO(1–0) and Paα emissions over-plotted in green and pink contours, respectively. The CO(1–0) intensity map shows the synthesized beam size. In the velocity and velocity dispersion maps, the white cross indicates the location of the best-fitted dynamical centre. The velocity maps have the velocity contours over-plotted from their best-fit disc models, and the green- and pink-dashed lines represent the molecular and ionized gas major kinematic axes, respectively. In each velocity dispersion map, the white circumference represents the boundary of the region masked during the estimation of the global velocity dispersion value. The residual fields are constructed by subtracting the velocity disc models from the velocity maps. The rms of these residuals are given in each panel. In the case of the HATLAS090750 Paα observation, we only show the modelled central zone in the residual map.
Current usage metrics show cumulative count of Article Views (full-text article views including HTML views, PDF and ePub downloads, according to the available data) and Abstracts Views on Vision4Press platform.
Data correspond to usage on the plateform after 2015. The current usage metrics is available 48-96 hours after online publication and is updated daily on week days.
Initial download of the metrics may take a while.