Fig. 2.
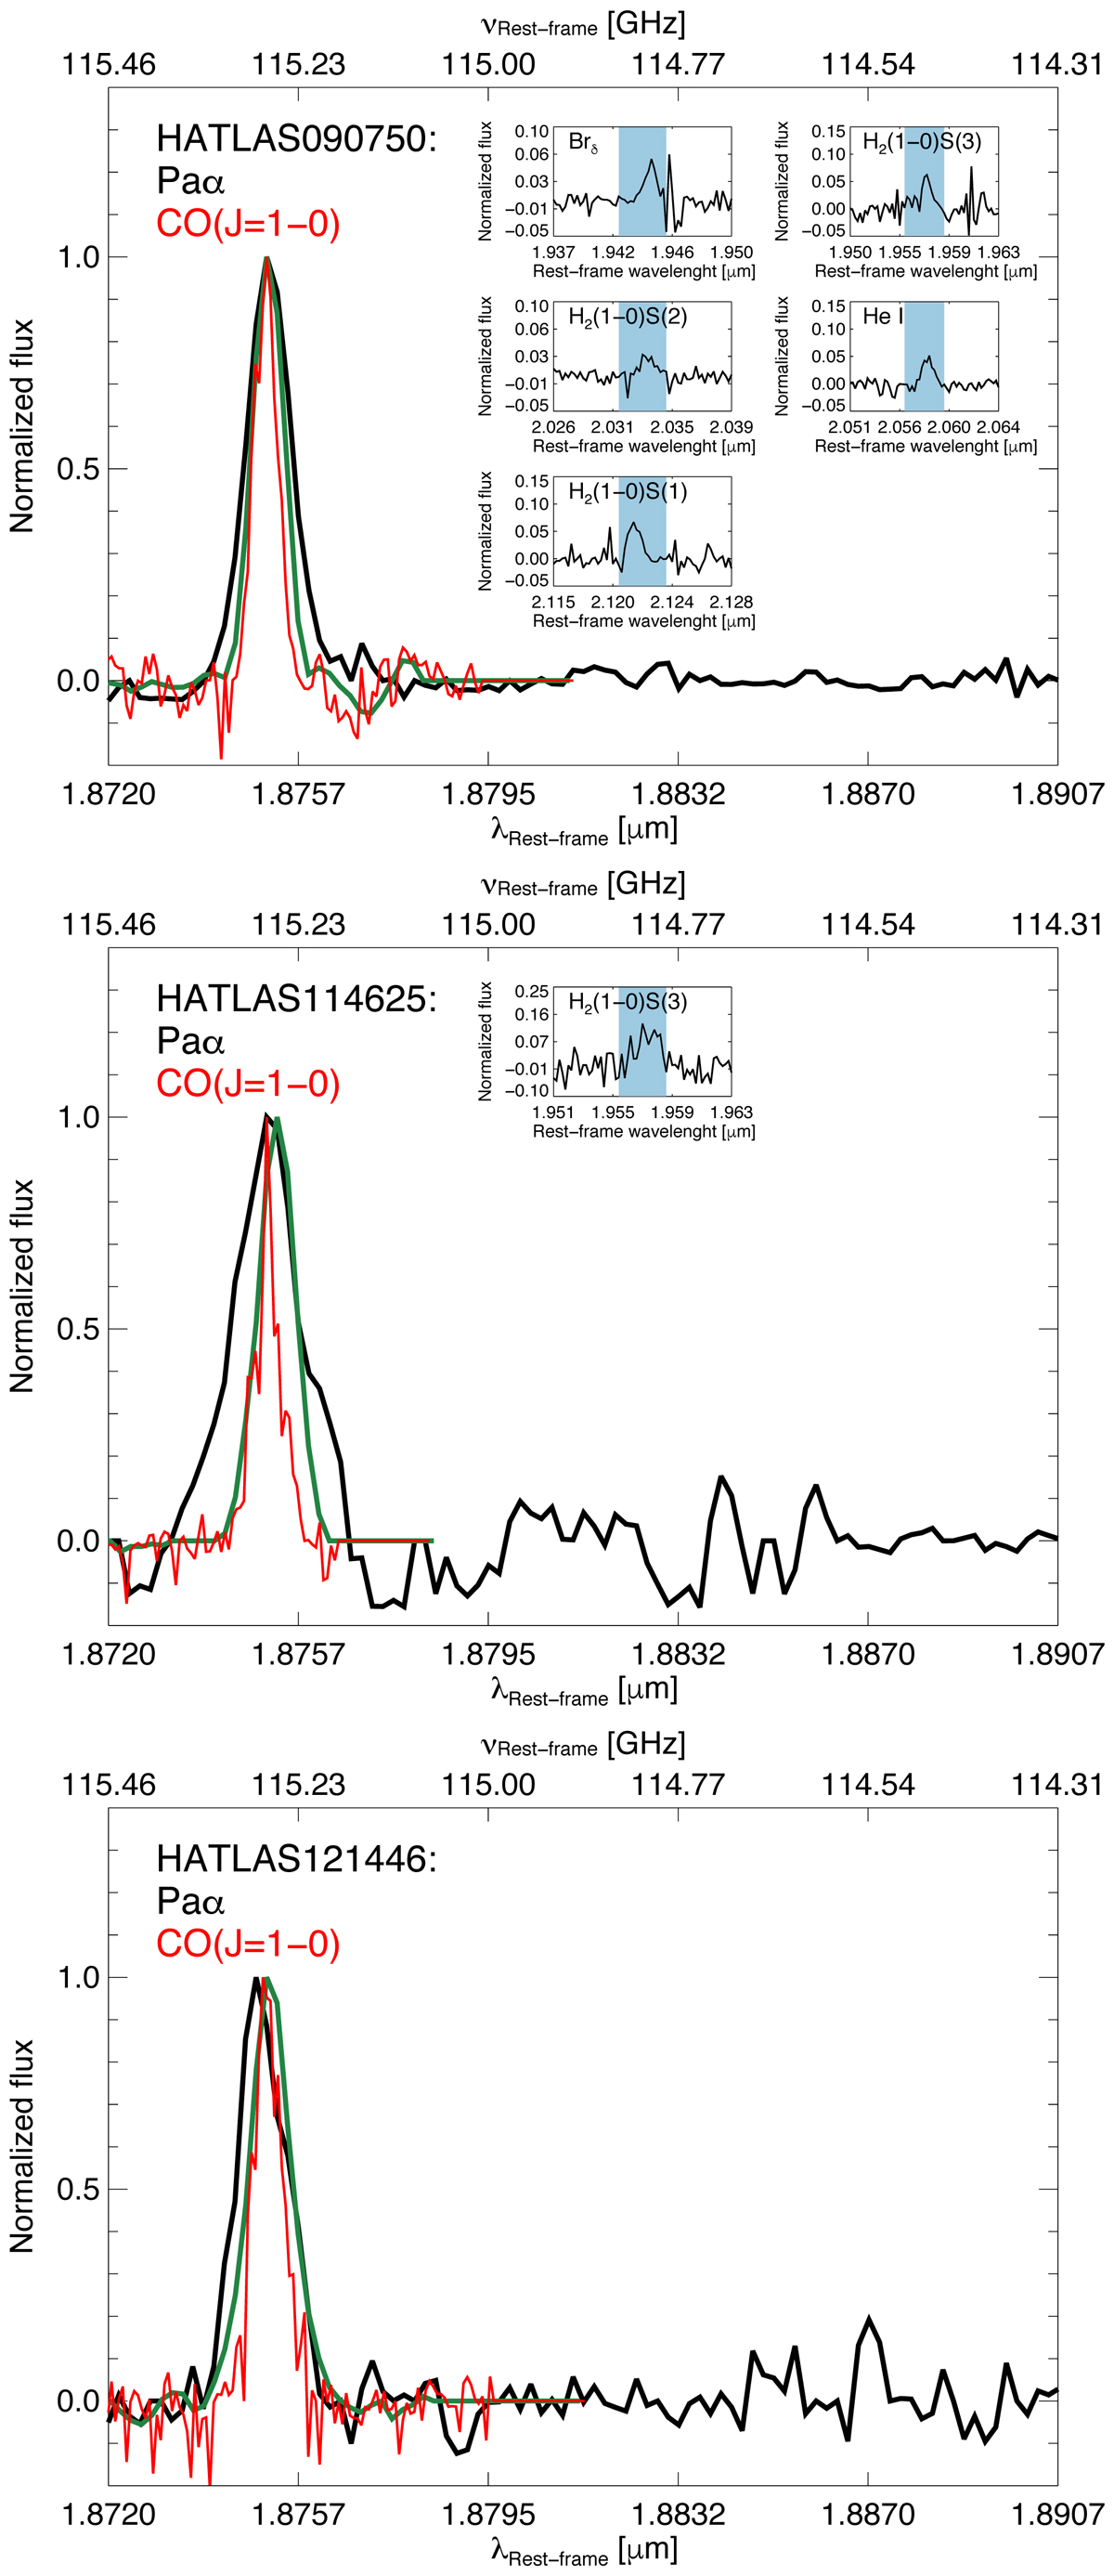
Spatially integrated rest-frame spectra around the emission lines of interest. The bottom and top x-axes show the rest-frame wavelength and frequency ranges for the Paα and CO(1–0) emission lines, respectively. For each galaxy, the solid green curve shows the CO(1–0) spectrum convoluted by the SINFONI LSF. From HATLAS090750, we also detect the Brδ, H2(1–0)S(3), H2(1–0)S(2), H2(1–0)S(1), and He I near-IR emission lines using as an aperture an encircled zone given by the PSF FWHM and centred at the Paα luminosity peak. In the case of the HATLAS114625 galaxy observation, we also detect the H2(1–0)S(3) emission. These detections are shown in the sub-plots (blue-shaded area) in each panel (see also Appendix C). The CO(1–0) and Paα emission lines are clearly detected.
Current usage metrics show cumulative count of Article Views (full-text article views including HTML views, PDF and ePub downloads, according to the available data) and Abstracts Views on Vision4Press platform.
Data correspond to usage on the plateform after 2015. The current usage metrics is available 48-96 hours after online publication and is updated daily on week days.
Initial download of the metrics may take a while.