Fig. 1.
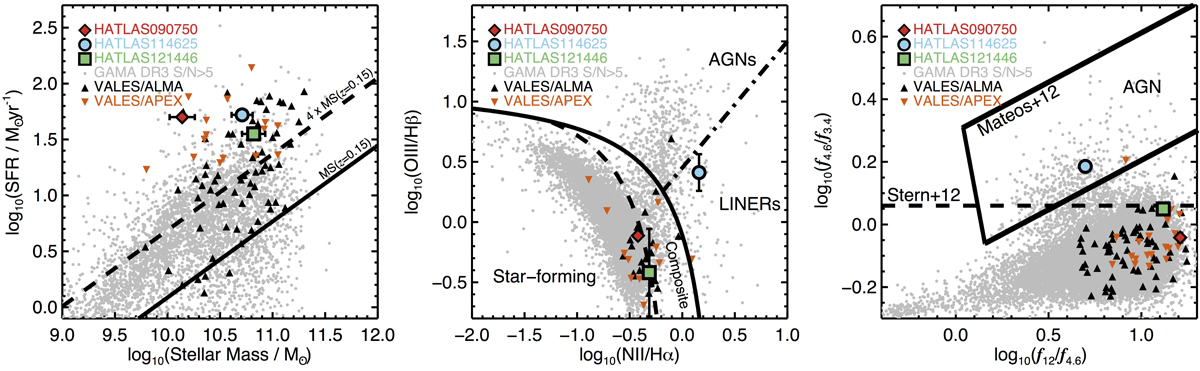
Characterization of the three galaxies presented in this work in terms of stellar mass, SFRs, and AGN activity. Left: SFR–M⋆ plane. The solid and dashed lines represent the main-sequence (MS) parametrization suggested by Whitaker et al. (2012) and the 4 × SFR(MS) starburst threshold, respectively. Middle: BPT-diagram (Baldwin et al. 1981). The dashed curve shows the empirical star-forming threshold (Kauffmann et al. 2003), whereas the solid curve corresponds to the theoretical maximum starburst model (Kewley et al. 2001). These two lines encompass the SFGs-AGN “composite” zone. The dotted-dashed line indicates the division between AGNs and LINERs (Schawinski et al. 2007). Right: WISE mid-IR colour-colour diagram. The solid lines delimit the AGN-zone suggested by Mateos et al. (2012), whereas the dashed line represents the AGN threshold adopted by Stern et al. (2012). The WISE data 1-σ errorbars are smaller than the plotted symbol sizes. The GAMA data are taken from their data-release 3 (GAMA-DR3; Baldry et al. 2018), encompassing galaxies at z < 0.35 (the upper redshift limit for the VALES survey) and with 5-σ or higher flux estimates. These three panels indicate that the three galaxies presented in this work can be classified as starbursts, with one target (HATLAS114625−014511) likely to be classified as an obscured AGN host galaxy.
Current usage metrics show cumulative count of Article Views (full-text article views including HTML views, PDF and ePub downloads, according to the available data) and Abstracts Views on Vision4Press platform.
Data correspond to usage on the plateform after 2015. The current usage metrics is available 48-96 hours after online publication and is updated daily on week days.
Initial download of the metrics may take a while.