| Issue |
A&A
Volume 643, November 2020
|
|
|---|---|---|
| Article Number | A174 | |
| Number of page(s) | 8 | |
| Section | Extragalactic astronomy | |
| DOI | https://doi.org/10.1051/0004-6361/202038923 | |
| Published online | 20 November 2020 | |
uGMRT HI 21-cm absorption observations of two extremely inverted spectrum sources⋆
1
Thüringer Landessternwarte, Sternwarte 5, 07778 Tautenburg, Germany
e-mail: This email address is being protected from spambots. You need JavaScript enabled to view it.
2
Department of Physics, Savitribai Phule Pune University, Ganeshkhind, Pune 411007, India
3
Inter University Centre for Astronomy and Astrophysics (IUCAA), Pune 411007, India
4
UM-DAE Centre for Excellence in Basic Sciences (CEBS), Univ. of Mumbai Campus, Vidya Nagari, Mumbai 400098, India
5
ARIES, Manora Peak, Nainital, 263002 Uttarakhand, India
Received:
14
July
2020
Accepted:
26
September
2020
Abstract
We report the detection of HI 21-cm absorption in a member of the rare and recently discovered class of compact radio sources: extremely inverted spectrum extragalactic radio sources (EISERS). The EISERS conceivably form a special subclass of the inverted spectrum radio galaxies since the spectral index of the optically thick part of the spectrum for these sources crosses the synchrotron self-absorption limit of α = +2.5 (S(ν) ∝ να). We searched for HI absorption in two EISERS using the recently upgraded Giant Metrewave Radio Telescope (uGMRT) and detected an absorption feature in one of them. The strong associated HI absorption detected against the source J1209−2032 (z = 0.4040) implies an optical depth of 0.178 ± 0.02, corresponding to an HI column density of 34.8 ± 2.9 × 1020 cm−2, for an assumed HI spin temperature of 100 K and covering factor of 1. This is among the highest known optical depth and HI column densities found for compact radio sources of peaked spectrum type and supports the free-free absorption model for the steeply inverted radio spectrum of this source. For the other source, J1549+5038 (z = 2.171), no HI absorption was detected in our observations.
Key words: radiation mechanisms: non-thermal / galaxies: active / galaxies: ISM / radio lines: ISM
The reduced spectra are only available at the CDS via anonymous ftp to cdsarc.u-strasbg.fr (130.79.128.5) or via http://cdsarc.u-strasbg.fr/viz-bin/cat/J/A+A/643/A174
© ESO 2020
1. Introduction
The gigahertz-peaked-spectrum sources (GPS) and compact-steep-spectrum sources (CSS), which are known to be evolving young radio galaxies, are ideal candidates to study the co-evolution of radio jets and their host galaxies (O’Dea 1998). The inverted spectrum in the GPS and CSS sources is a result of absorption of synchrotron radiation at low (sub-GHz) radio frequencies, either due to synchrotron self-absorption (SSA) and/or free-free absorption (FFA) processes (e.g., O’Dea 1998). The GPS and CSS sources have small physical extents (<10 kpc) but morphologies similar to large-scale (>100 kpc) powerful radio galaxies with giant radio lobes (Wilkinson et al. 1994; Stanghellini et al. 1997; Orienti et al. 2006). The youth scenario for these sources is well supported by the age estimates (<105 years) from the proper motion of their hotspots obtained from very long baseline interferometry (VLBI), and, indirectly, from spectral ageing analyses (Owsianik & Conway 1998; Polatidis & Conway 2003; Gugliucci et al. 2005).
The radio spectrum predicted from numerical simulations of jet-interstellar matter (ISM) interactions in young active galactic nuclei (AGNs) have shown that the slope of the inverted part of the low radio-frequency spectrum depends on the age of the radio source, with the most inverted spectral index corresponding to the youngest sources (see Fig. 1, Bicknell et al. 2018). Hence, in an attempt to understand the evolution of AGNs and study the absorption mechanisms operating in such sources, we started a program using the upgraded Giant Metrewave Radio Telescope (uGMRT, Gupta et al. 2017) to identify inverted spectrum sources that have a spectral index, α (between 150 and 325 MHz; observed quasi-simultaneously), greater than the critical value of α > +2.5, the theoretically allowed spectral index for SSA occurring in a homogeneous radio source (Slish 1963; Kellermann 1966). The program has led to the detection of seven sources with α > +2.5 (within uncertainties), four of them having α > +2.75. These sources were termed as extremely inverted spectrum extragalactic radio sources (EISERS; Gopal-Krishna et al. 2014; Mhaskey et al. 2019a,b). The numerical fitting based on different absorption models, to the observed spectral energy distributions for the seven EISERS, indicates that the FFA model within an external in-homogeneous screen of thermal plasma (Bicknell et al. 1997, 2018) may be the preferred alternative, since fitting the SSA model would need a departure from the standard synchrotron emission scenario that is based on a power-law energy distribution of the radiating relativistic electrons (Rees 1967; Begelman 1996; Gopal-Krishna et al. 2014).
The FFA model predicts free-free absorption of the synchrotron emission from the radio source by the intervening ISM of the host galaxy, likely in the vicinity of the radio source. Quite plausibly, the efficiency of the FFA is strongly dependent on the presence of dense ionized gas in the circumnuclear region (Peck et al. 1999; Kameno et al. 2000; Marr et al. 2001). Indications for such dense plasma regions could come from a variety of mutiwavelength studies, such as the detection of broadened emission lines, indicating a strong interaction between the radio jets/lobes and the ISM (Gelderman & Whittle 1994; Zovaro et al. 2019). Likewise, the discovery of high-rotation measures and indications of strong depolarization would indicate the presence of high electron densities and magnetic fields (Stanghellini et al. 1998).
Moreover, HI observations provide an alternative means to study the gas content in the GPS and CSS sources. Although, only a minor fraction of the total gas content in the ISM comprises cold neutral gas, it provides a lower limit to the total gas mass and density (Pihlström et al. 2003). Additionally, the characteristics of the HI absorption profile can provide valuable information on the gas kinematics within the narrow-line-region (NLR) of the host galaxy and ascertain whether a localized outflow of neutral gas is occurring due to jet-ISM interactions, as predicted by some recent simulations (Bicknell et al. 2018; Mukherjee et al. 2016) and indeed observed in neutral, molecular, and ionized gas components likely associated with the hosts of some radio galaxies (Morganti & Oosterloo 2018).
An understanding of the distribution and kinematics of different components of the circumnuclear gas and the extended ISM in the host galaxy is essential to understanding the mechanism fuelling the radio activity: the evolution of the radio source properties within the framework of the unified scheme. Over the years, HI 21-cm absorption line studies of radio sources have emerged as a powerful tool to constrain the properties of cool atomic gas associated with AGNs (e.g., Morganti et al. 2001; Vermeulen et al. 2003; Gupta et al. 2006; Geréb et al. 2014; Aditya & Kanekar 2018). Moreover, a difference in properties of the HI absorption in extended and compact radio sources has been reported (Morganti & Oosterloo 2018), such that the absorption is detected more often in the case of compact (GPS and CSS) sources, that is, young radio sources still evolving through the host galaxy’s ISM, as compared to the extended radio sources. The detection rate of HI absorption is found to be as high as 40−45% (Morganti & Oosterloo 2018). On the other hand, Curran & Whiting (2010) found that the 21-cm absorption is not detected in objects that have a high ultraviolet luminosity (LUV ∼ 1023 W Hz−1. Hence they propose that the presence of 21-cm absorption shows a preference for radio galaxies over quasars, and the higher detection rate in compact sources (e.g., GPS and CSS) may be biased by the inclusion of sources with high ultraviolet luminosity.
With the aforementioned motivation, we recently conducted a HI absorption study of two EISERS out of the seven mentioned above, since the spectroscopic redshifts for the two could be obtained from the literature. In this paper, we report the results from this HI study and place them in the context of similar detections reported for GPS and CSS radio sources. The paper is divided into five sections. In Sect. 2, we describe the sample and its multiwavelength observations (optical and radio) taken from the literature. Details of our uGMRT HI observations and analysis are reported in Sect. 3. Section 4 contains a brief discussion of the observational results, followed by a summary of this study in Sect. 5.
2. Sample of EISERS for HI absorption
The two sources, J1209−2032 and J1549+5038, for which spectral line observations are reported in this paper, belong to the sample of seven EISERS with a spectral index α > +2.5 between the frequencies 150 and 325 MHz, as found by conducting quasi-simultaneous uGMRT observations at the two frequencies. The two sources were selected because their spectroscopic redshifts are available in the literature, which is a critical requirement for HI absorption spectroscopy. For the remaining five sources, this crucial information is unfortunately lacking. In the future, we intend to start a separate program to measure the redshifts of EISERS, so that the sample may be enlarged to enable us to reach general conclusions. The coordinates, optical identifications, and flux densities for the two sources, namely J1209−2032 and J1549+5038, are provided in Table 1.
Observational parameters of J1209−2032 and J1549+5038.
2.1. J1209−2032 and J1549+5038
Radio properties. The sources J1209−2032 and J1549+5038 are inverted spectrum sources, with spectra peaking near the rest-frame frequencies of 430 MHz and 1407 MHz, respectively. The spectral index (150−325 MHz) below the turnover frequency is α > +2.64 for J1209−2032 and +2.42 ± 0.22 for J1549+5038 (Mhaskey et al. 2019a,b), whereas the theoretical SSA limit for a homogeneous synchrotron radio source is +2.5. The AT20G catalogue reports fractional polarization of 1% at 20 GHz, 8 GHz, and 5 GHz for J1209−2032 (Murphy et al. 2010). For the source J1549+5038 Pasetto et al. (2016) inferred a large (rest-frame) rotation measure (RM = 1400 ± 500 rad m−2). The available radio continuum data for J1549+5038 confirms a strong flux variability at centimetre wavelengths, as cited in Mhaskey et al. (2019b).
VLBI structure. The milli-arcsecond resolution images of the source J1209−2032 from the VLBI FITS image database at 2.3, 5, and 7.6 GHz (Beasley et al. 2002) reveal a pair of lobes, with total extension of ∼60 mas (300 pc). It is evident from the multifrequency VLBI data that the western component contains the flat spectrum core. The core contributes nearly 56% of the total flux at 5 GHz measured with the single-dish Parkes telescope (PKS90, Wright & Otrupcek 1990). In the VLBI images of the source J1549+5038 at 5 GHz (Xu et al. 1995; Helmboldt et al. 2007) and at 2 and 8 GHz (Fey & Charlot 2000), the source appears resolved into a dominant flat-spectrum core and a fairly bright curved jet, which is ∼20 mas (180 pc) long and extends toward the south-west. The jet is itself resolved into a couple of knots. The core contributes nearly 67% of the total flux at 5 GHz as measured with the single-dish Green Bank telescope (87 GB, Gregory & Condon 1991).
Optical spectra. The source J1209−2032 (z = 0.404 ± 0.002) is classified as a red elliptical galaxy with no sign of interaction with the nearby galaxies (Jackson et al. 2002). Its low-resolution spectrum obtained with the European Southern Observatory’s 3.6 m telescope reveals an early-type galaxy with old stellar population and weak emission lines [OII, OIII], indicating an AGN (Hook et al. 2003). There is no sign of variability in the two SDSS spectra taken 11 years apart. J1549+5038 (z = 2.17428 ± 0.00015) is a type 1 quasar with broad emission lines seen in its SDSS spectrum. No sign of merger or interaction is visible in the SDSS image.
As inferred from the inverted low-frequency radio spectra of both these sources, and also seen from the linear scales of their VLBI images, sources are compact, like GPS sources. But unlike the rolling down of the radio spectrum beyond the spectral peak, which is characteristic of GPS sources, the spectra of these two sources appear relatively flat at higher frequencies (>1 GHz) (Mhaskey et al. 2019a,b). Sparse and nonsimultaneous spectral coverage could often lead to genuine GPS sources being misclassified as flat-spectrum quasars, and vice-versa (Massaro et al. 2014). Hence, J1209−2032 and J1549+5038 could also be GPS types.
3. The uGMRT HI observations and data analysis
We observed the sources in our sample on 05 November 2019 using Band 5 (J1209−2032) and Band 3 (J1549+5038) of uGMRT. For both observations, a bandwidth of 12.5 MHz split into 4096 frequency channels was used. The observing band was centered at 1011.7 MHz for J1209−2039 and at 447.5 MHz for J1549+5038. We observed the standard flux density calibrator 3C286 for 10 min at the beginning and at the end of each observing run to obtain reliable flux density and bandpass calibrations. A nearby compact radio source was also observed periodically for phase calibration. The total on-source time for J1209−2039 and J1549+5038 was 70 min and 64 min, respectively. Only parallel polarization products were recorded.
The uGMRT data were processed using the Automated Radio Telescope Imaging Pipeline (ARTIP) that is being developed to perform the end-to-end processing (i.e., from the ingestion of the raw visibility data to the spectral line imaging) of data from the uGMRT and MeerKAT absorption line surveys (Gupta et al. 2016). The pipeline is written using standard PYTHON libraries and the CASA package. The details are provided in Gupta et al. (2020).
In short, following data ingestion, the pipeline automatically identifies bad antennas, baselines, time ranges, and radio frequency interference (RFI), using directional and median absolute deviation statistics. After excluding these bad data, the complex antenna gains as a function of time and frequency are determined using the standard flux/bandpass and phase calibrators. Applying these gains, a continuum map that relies on a user-defined range of frequency channels (here excluding channels with absorption) is made. Using this map as an input model, self-calibration complex gains are determined and then applied to all the frequency channels. Here, we performed three rounds of phase-only and one round of amplitude-and-phase self-calibration, and for imaging we used ROBUST=0.5 weighting in tclean task of CASA.
The radio source J1209−2032 is seen to be compact in our stokes-I uGMRT image at 1011.7 MHz (Fig. 1). The image has a synthesized beam of 4.3″ × 2.7″ with a position angle of −35° and an rms of 0.8 mJy beam−1. The deconvolved size of the source is 0.8″ × 0.5″ (position angle = 125°), which is consistent with the source being unresolved. The total flux density is 448.2 mJy.
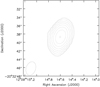 |
Fig. 1. uGMRT stokes-I image of source J1209−2032 at 1011.7 MHz. The contours are drawn at 3, 4, 8, 16, 32, 64, 128, 256, 512, 1024, and 2048 times the image rms noise, which is 0.8 mJy. The beam size is 4.3″ × 2.7″ (position angle = −35°). |
The rms noise in the continuum image of J1549+5038 at 447.5 MHz with a synthesized beam of 7.7″ × 5.6″ (position angle = 57°) is 1.1 mJy beam−1. The deconvolved size is 3.5″ × 0.4″ (position angle = 50°). The source may be marginally resolved. Its peak and total flux densities are 429 mJy beam−1 and 472 mJy, respectively.
The ARTIP then used CLEAN component models based on the above-mentioned radio continuum maps to subtract the continuum emission from the uv data. This continuum-subtracted data set was then imaged to obtain the spectral-line cubes.
In Figs. 2 and 3, we present stokes-I 21-cm absorption spectra toward the sources. The spectra were smoothed over five consecutive spectral channels to improve the signal-to-noise ratio. The spectral resolution and rms noise in the smoothed spectra are 0.9 km s−1 and 1.9 mJy beam−1 channel−1 (J1209−2032), and 2.0 km s−1 and 3.1 mJy beam−1 channel−1 (J1549+5038), respectively. The spectra have been normalized with respect to the peak flux density. An absorption line is clearly detected toward J1209−2032 but not toward J1549+5038. The feature at 200 km s−1 (Fig. 3) that looks like emission is due to weak RFI that is present only in stokes LL.
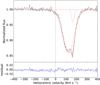 |
Fig. 2. Stokes-I 21-cm absorption spectra toward J1209−2032. The spectrum was smoothed over five consecutive spectral channels to improve the signal-to-noise ratio, and normalized with respect to the peak flux density. The spectral resolution and rms noise in the smoothed spectra are 0.9 km s−1 and 1.9 mJy beam−1 channel−1, respectively. |
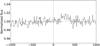 |
Fig. 3. Stokes-I 21-cm absorption spectra toward J1549+5038. The spectrum was smoothed over five consecutive spectral channels and normalized with respect to the peak flux density. The spectral resolution and rms noise in the smoothed spectra are 2.0 km s−1 and 3.1 mJy beam−1 channel−1, respectively. The feature at 200 km s−1 that looks like emission is due to weak RFI present only in LL. |
For an optically thin cloud, the peak 21-cm optical depth, τp is related to the neutral hydrogen column density:
 (1)
(1)
where, Ts is the system temperature, fc is the covering factor, the fraction of the background emission covered by the absorber, and Δv is the full width at half maximum (FWHM) of the absorbed line.
The HI line is detected toward the source J1209−2032, with a peak optical depth of τp = 0.178 ± 0.02 and a neutral hydrogen column density of N(HI) = 34.8 ± 2.9 × 1020 cm−2, assuming fc = 1 and Ts = 100 K. Here we assume that the gas covers the radio source completely. However, the observed radio size from VLBI may only be a lower limit to the actual radio extent.
No HI absorption is detected toward the source J1549+5038. Taking its flux density as 429 mJy, based on the present observations, we place a 3σ upper limit of < 0.008 on the optical depth from the spectra shown in Fig. 3. The corresponding upper limit on the column density is NHI < 1.4 × 1020 cm−2 (assuming fc = 1 and Ts = 100 K).
4. Discussion
Since the source J1209−2032 with detected HI absorption shows a well-resolved mildly asymmetric HI absorption line profile, it has been fit with two Gaussian components. The velocity offset of the HI line centroid from the optical redshift is 144.01 km s−1. For the first Gaussian, the peak optical depth and FWHM are 0.0437 ± 0.015 and 32.128 ± 5.74 km s−1, respectively. The derived column density is NHI = 2.7 ± 1.1 × 1020 cm−2 for fc = 1 and Ts = 100 K. For the second Gaussian, the peak optical depth and FWHM are 0.1345 ± 0.0079 and 121.813 ± 4.47 km s−1, respectively. The derived column density is NHI = 32.1 ± 2.7 × 1020 cm−2 for fc = 1 and Ts = 100 K.
The HI profile is mildly shifted with respect to the systemic frequency. However, an error of 0.002 in redshift (z = 0.404) of the source corresponds to an error of 1 MHz in its systemic frequency, which is approximately ±300 km s−1 in the velocity range. Hence, the observed shift is well within the error limits of the systemic frequency.
Moreover, in general, velocities of < ∼200 km s−1 at the systemic velocity can be just due to regular rotation in the galactic circumnuclear HI disk (Pihlström et al. 2003). The broad width observed in this case is due to rotational velocities, which is typically associated with the rotating gas structures in the host galaxies (Morganti & Oosterloo 2018). On the other hand, the line profiles with FWHM widths broader than > 500 km s−1 require physical processes other than just rotational velocities (e.g., disturbed kinematics due to mergers and outflows) in order to accelerate the gas to such high velocities (Geréb et al. 2015).
Remarkably, the optical depth estimated for the source J1209−2032 is one of the highest known for GPS and CSS sources. In a HI absorption study of galaxies with z > 0.2, Dutta et al. (2018) reported that 40% of sources with column densities of HI > 1021 cm−2, and 100% of sources with HI > 1022 cm−2 are associated with mergers. Also, the HI detection rate is high (∼80%) in merging systems. Dutta et al. (2018) used SDSS images of galaxies to identify signatures of galaxy mergers. However, no evidence of a merger is found in the SDSS optical image of J1209−2032 (Sect. 2).
The integrated optical depth can be used to derive a lower limit to the total gas content in the galaxy (Pihlström et al. 2003). The high value of optical depth suggests that the radio source, J1209−2032, is embedded in a rich ISM, which has implications for the role of AGN feedback in the galaxy evolution (Morganti & Oosterloo 2018). Also, the dense environment indicated by the high optical depth would be consistent with the possibility of FFA mechanism being responsible for the sharp spectral turnover witnessed for the source J1209−2032, as inferred for GPS and CSS sources (Pihlström et al. 2003; Bicknell et al. 2018). A discussion on the FFA process operating in such extremely inverted sources is provided in Mhaskey et al. (2019b).
4.1. Discussing the case of J1549+5038
4.1.1. The non-detection of HI absorption
In the source J1549+5038, the non-detection of HI 21-cm absorption could be attributed to it being a quasar. The high redshift (z = 2.171) of this source implies a high ultraviolet (UV) luminosity of ∼3 × 10²³ W Hz−1 at the NUV waveband (λeff ∼ 2267 Å) in the GALEX observations (Bianchi et al. 2017). As argued by Curran et al. (2008), at a UV luminosity above LUV ∼ 1023 W Hz−1, the excitation and ionization of the hydrogen gas may be severe, depleting the neutral hydrogen and thereby depressing HI absorption (Curran et al. 2008, 2013; Morganti & Oosterloo 2018). This argument was first advanced by Curran et al. (2008) to explain the striking lack of HI absorption in the radio spectra of z > 2 (see also, Glowacki et al. 2017). The UV luminosity of J1549+5038 is also close to the limit where all of the gas is expected to be ionized (Curran & Whiting 2012). It is interesting that, consistently with this suggestion, the most distant GPS radio source with detected HI absorption has only a modest redshift (z = 1.275, Aditya & Kanekar 2018).
4.1.2. Implications of a high RM
Quite a few of the GPS and CSS sources are known to have high RM values (>1000 rad m−2 in the rest frame). O’Dea (1998) compiled a list of GPS and CSS sources with known RMs from Kato et al. (1987), Aizu et al. (1990), Taylor et al. (1992) and Inoue et al. (1995). Out of the 31 sources, 11 have RMs > 1000 rad m−2. Also, compared to galaxies, GPS sources associated with quasars have a wider RM range, and the smallest and the largest values of RM are identified with quasars. O’Dea (1998) also estimated the electron densities in the environment of GPS and CSS sources with large RMs. They found that the sources with high RMs are associated with high electron densities, thus supporting the notion that the large RMs in some GPS and CSS sources could be due to a dense magneto-ionic medium surrounding the source. Recently, broadband polarization studies of a sample of compact AGNs by Pasetto et al. (2016), with sources selected on the criterion of a strong depolarization at 1.4 GHz, have revealed that the sources with young or newly ejected radio components (e.g., GPS and HFP sources) have a high rest frame RM (>1000 rad m−2). These sources are thus characterized by a dense magnetized medium that strongly rotates the angle of polarization, leading to a large RM (Pasetto et al. 2016).
Thus, a high RM (1400 ± 500 rad m−2) in the source J1549+5038 indicates the presence of a dense magneto-ionic plasma. This provides a more direct way of estimating the ionized gas density in the environment of the source and supports the role of the in-homogeneous FFA model for the steep radio spectral turnover.
4.2. Comparison with GPS and CSS sources
Due to the compact nature of J1209−2032 and J1549+5038 and for the sake of uniformity with other EISERS that show a more convex radio spectrum, it is appropriate to compare the HI properties of these two sources with those of GPS and CSS sources. In GPS and CSS sources, the HI absorption spectra more often indicate gas with disturbed kinematics traced by the asymmetric and highly blueshifted profiles (Geréb et al. 2015; Glowacki et al. 2017; Morganti & Oosterloo 2018). As discussed above, no such signature is evident in the HI spectrum of the radio galaxy J1209−2032. However, we note that in the sample of radio galaxies showing HI absorption taken from Geréb et al. (2015) and Glowacki et al. (2017), only about 15% show fast outflows with FWHM > 500 km s−1 (Morganti & Oosterloo 2018). Most of these outflows occur in either young radio galaxies or restarted radio galaxies (Aditya & Kanekar 2018; Morganti & Oosterloo 2018, and references therein).
From a sample of 41 GPS and CSS sources compiled by Pihlström et al. (2003), HI absorption is detected in 22 sources. In this sample, HI column densities of the sources are found to be anti-correlated with the radio source sizes. The optical depth was also found to be anti-correlated with source sizes, albeit with a large scatter (Morganti & Oosterloo 2018), and, moreover, the HI column density is related to the linear size (L) as: NHI = 7.2 × 10¹⁹ L−0.43 cm−2. Pihlström et al. (2003) suggested that this correlation manifests an ambient medium whose density decreases with radial distance from the center. However, Curran et al. (2013) attributed this correlation to a geometrical effect, with a larger covering factor associated with smaller source sizes. Further, they propose that the relation is based on the assumption of a spin temperature and covering factor (where Ts/f is 100). For sources where column densities are known, the Ts/f is seen to vary by a factor of at least ∼170 (for Ts = 60 K to 9950 K). Therefore, the above presumption and the observed large scatter in FWHM implies that the integrated optical depth is dominated by the peak optical depth, which is physically motivated, and the observed relationship arises directly from an optical depth and linear size anti-correlation (Curran et al. 2013).
We further inspect this correlation using an extended and revised sample of GPS and CSS sources. The updated sample contains all the known GPS and CSS sources north of −30° in which HI absorption has been searched for, using various radio telescopes (Vermeulen et al. 2003; Pihlström et al. 2003; Gupta & Saikia 2006; Chandola et al. 2011; Geréb et al. 2015; Grasha et al. 2019). The GPS and CSS sources covered in these studies were drawn from Spencer et al. (1989), Fanti et al. (1990), Sanghera et al. (1995), Taylor et al. (1996), de Vries et al. (1997), O’Dea & Baum (1997), Morganti et al. (1997), Peck & Taylor (2000), and Xiang et al. (2005). The sources classified as CSS sources in the literature, showing hints of spectral flattening toward lower radio frequencies (as seen in NED), but poorly sampled below the turnover frequency, were excluded. The final list consists of 48 GPS and 33 CSS sources. HI absorption is detected in 24 (∼31%) of the sources, as plotted in Fig. 4 (see Tables A.1 and A.2). We also display our HI detection for the EISERS J1209−2032 and the upper limits for J1549+5038 in the plot.
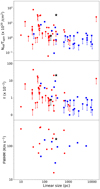 |
Fig. 4. Various spectral parameters for present sample of GPS and CSS sources plotted against their linear sizes, with the superposition of EISERS J1209−2032 and J1549+5038 (star symbol). The filled circles represent GPS sources, and the square symbol represents CSS sources. The error bars for the source J1209−2032 are of the order of the symbol size. |
As seen from Fig. 4, EISERS J1209−2032 does not follow the correlation between HI optical depth and linear size. The optical depth of J1209−2032 is high compared to other GPS and CSS sources with similar linear sizes. This may be due to an asymmetric (nonspherical) distribution of the absorbing disk material relative to the radio structure, unlike the ideal spherical distribution assumed by Pihlström et al. (2003) or due to a geometrical effect as proposed by Curran et al. (2013) (see the discussion above).
5. Summary and conclusions
As an initial step toward characterizing the occurrence and properties of the neutral gas in EISERS, we report here the 21-cm spectral line study of EISERS. Using the uGMRT, we observed two out of the seven known EISERS and detected HI absorption in the source J1209−2032 (z = 0.404), identified with a galaxy. The detection of a very high optical depth (0.178 ± 0.02) indicates a dense ISM conducive to the FFA scenario in this source. The moderate FWHM of the absorption profile (156 ± 10.2 km s−1), is typical of the rotating gas structures in galaxies. For the other source, J1549+5049 (z = 2.171), which is classified as quasar, we do not detect any HI absorption, which seems consistent with its high output of ionising UV photons. As the next step, we have planned HI spectroscopy of the remaining five EISERS, after obtaining their redshifts. This would allow us to place the EISERS reliably within the HI absorption distribution known for GPS and CSS sources, particularly in the context of the FFA scenario for the radio spectral turnover.
Acknowledgments
We thank the staff of the GMRT who have made these observations possible. GMRT is run by the National Centre for Radio Astrophysics of the Tata Institute of Fundamental Research. This research has used NASA’s Astrophysics Data System and NASA/IPAC Extragalactic Database (NED), Jet Propulsion Laboratory, California Institute of Technology under contract with National Aeronautics and Space Administration and VizieR catalogue access tool, CDS, Strasbourg, France. SP would like to thank DST INSPIRE Faculty Scheme (IF12/PH-44) for funding his research group. G.-K. acknowledges the Senior Scientist Fellowship of the Indian National Science Academy.
References
- Aditya, J. N. H. S., & Kanekar, N. 2018, MNRAS, 473, 59 [NASA ADS] [CrossRef] [Google Scholar]
- Aizu, K., Inoue, M., Tabara, H., & Kato, T. 1990, in Galactic and Intergalactic Magnetic Fields, eds. R. Beck, P. P. Kronberg, & R. Wielebinski, IAU Symp., 140, 472 [CrossRef] [Google Scholar]
- Beasley, A. J., Gordon, D., Peck, A. B., et al. 2002, ApJS, 141, 13 [NASA ADS] [CrossRef] [Google Scholar]
- Begelman, M. C. 1996, in Baby Cygnus A’s, eds. C. L. Carilli, & D. E. Harris, 209 [Google Scholar]
- Bianchi, L., Shiao, B., & Thilker, D. 2017, ApJS, 230, 24 [NASA ADS] [CrossRef] [Google Scholar]
- Bicknell, G. V., Dopita, M. A., & O’Dea, C. P. O. 1997, ApJ, 485, 112 [NASA ADS] [CrossRef] [Google Scholar]
- Bicknell, G. V., Mukherjee, D., Wagner, A. Y., Sutherland, R. S., & Nesvadba, N. P. H. 2018, MNRAS, 475, 3493 [NASA ADS] [CrossRef] [Google Scholar]
- Chandola, Y., Sirothia, S. K., & Saikia, D. J. 2011, MNRAS, 418, 1787 [NASA ADS] [CrossRef] [Google Scholar]
- Condon, J. J., Cotton, W. D., Greisen, E. W., et al. 1998, AJ, 115, 1693 [NASA ADS] [CrossRef] [Google Scholar]
- Curran, S. J., & Whiting, M. T. 2010, ApJ, 712, 303 [NASA ADS] [CrossRef] [Google Scholar]
- Curran, S. J., & Whiting, M. T. 2012, ApJ, 759, 117 [NASA ADS] [CrossRef] [Google Scholar]
- Curran, S. J., Whiting, M. T., Wiklind, T., et al. 2008, MNRAS, 391, 765 [NASA ADS] [CrossRef] [Google Scholar]
- Curran, S. J., Allison, J. R., Glowacki, M., Whiting, M. T., & Sadler, E. M. 2013, MNRAS, 431, 3408 [NASA ADS] [CrossRef] [Google Scholar]
- de Vries, W. H., Barthel, P. D., & O’Dea, C. P. 1997, A&A, 321, 105 [NASA ADS] [Google Scholar]
- Dutta, R., Srianand, R., & Gupta, N. 2018, MNRAS, 480, 947 [CrossRef] [Google Scholar]
- Fanti, R., Fanti, C., Schilizzi, R. T., et al. 1990, A&A, 231, 333 [NASA ADS] [Google Scholar]
- Fey, A. L., & Charlot, P. 2000, ApJS, 128, 17 [NASA ADS] [CrossRef] [Google Scholar]
- Gelderman, R., & Whittle, M. 1994, ApJS, 91, 491 [NASA ADS] [CrossRef] [Google Scholar]
- Geréb, K., Morganti, R., & Oosterloo, T. A. 2014, A&A, 569, A35 [NASA ADS] [CrossRef] [EDP Sciences] [Google Scholar]
- Geréb, K., Maccagni, F. M., Morganti, R., & Oosterloo, T. A. 2015, A&A, 575, A44 [NASA ADS] [CrossRef] [EDP Sciences] [Google Scholar]
- Glowacki, M., Allison, J. R., Sadler, E. M., et al. 2017, MNRAS, 467, 2766 [NASA ADS] [Google Scholar]
- Gopal-Krishna, Sirothia, S. K., Mhaskey, M., et al. 2014, MNRAS, 443, 2824 [NASA ADS] [CrossRef] [Google Scholar]
- Grasha, K., Darling, J., Bolatto, A., Leroy, A. K., & Stocke, J. T. 2019, ApJS, 245, 3 [CrossRef] [Google Scholar]
- Gregory, P. C., & Condon, J. J. 1991, ApJS, 75, 1011 [NASA ADS] [CrossRef] [Google Scholar]
- Gugliucci, N. E., Taylor, G. B., Peck, A. B., & Giroletti, M. 2005, ApJ, 622, 136 [NASA ADS] [CrossRef] [Google Scholar]
- Gupta, N., & Saikia, D. J. 2006, MNRAS, 370, 738 [Google Scholar]
- Gupta, N., Salter, C. J., Saikia, D. J., Ghosh, T., & Jeyakumar, S. 2006, MNRAS, 373, 972 [NASA ADS] [CrossRef] [Google Scholar]
- Gupta, N., Srianand, R., Baan, W., et al. 2016, MeerKAT Science: On the Pathway to the SKA, 14 [Google Scholar]
- Gupta, Y., Ajithkumar, B., Kale, H., et al. 2017, Curr. Sci., 113, 707 [NASA ADS] [CrossRef] [Google Scholar]
- Gupta, N., Jagannathan, P., Srianand, R., et al. 2020, ApJ, submitted [arXiv:2007.04347] [Google Scholar]
- Helmboldt, J. F., Taylor, G. B., Tremblay, S., et al. 2007, ApJ, 658, 203 [NASA ADS] [CrossRef] [Google Scholar]
- Hook, I. M., Shaver, P. A., Jackson, C. A., Wall, J. V., & Kellermann, K. I. 2003, A&A, 399, 469 [NASA ADS] [CrossRef] [EDP Sciences] [Google Scholar]
- Inoue, M., Tabara, H., Kato, T., & Aizu, K. 1995, PASJ, 47, 725 [NASA ADS] [Google Scholar]
- Jackson, C. A., Wall, J. V., Shaver, P. A., et al. 2002, A&A, 386, 97 [NASA ADS] [CrossRef] [EDP Sciences] [Google Scholar]
- Kameno, S., Horiuchi, S., Shen, Z.-Q., et al. 2000, PASJ, 52, 209 [NASA ADS] [CrossRef] [Google Scholar]
- Kato, T., Tabara, H., Inoue, M., & Aizu, K. 1987, Nature, 329, 223 [NASA ADS] [CrossRef] [Google Scholar]
- Kellermann, K. I. 1966, Aust. J. Phys., 19, 195 [Google Scholar]
- Marr, J. M., Taylor, G. B., & Crawford, F., III 2001, ApJ, 550, 160 [NASA ADS] [CrossRef] [Google Scholar]
- Massaro, F., Giroletti, M., D’Abrusco, R., et al. 2014, ApJS, 213, 3 [NASA ADS] [CrossRef] [Google Scholar]
- Mhaskey, M., Gopal-Krishna, Dabhade, P., et al. 2019a, MNRAS, 485, 2447 [Google Scholar]
- Mhaskey, M., Gopal-Krishna, Paul, S., et al. 2019b, MNRAS, 489, 3506 [Google Scholar]
- Morganti, R., & Oosterloo, T. 2018, A&ARv, 26, 4 [NASA ADS] [CrossRef] [Google Scholar]
- Morganti, R., Tadhunter, C. N., Dickson, R., & Shaw, M. 1997, A&A, 326, 130 [NASA ADS] [Google Scholar]
- Morganti, R., Oosterloo, T. A., Tadhunter, C. N., et al. 2001, MNRAS, 323, 331 [NASA ADS] [CrossRef] [Google Scholar]
- Mukherjee, D., Bicknell, G. V., Sutherland, R., & Wagner, A. 2016, MNRAS, 461, 967 [NASA ADS] [CrossRef] [Google Scholar]
- Murphy, T., Sadler, E. M., Ekers, R. D., et al. 2010, MNRAS, 402, 2403 [NASA ADS] [CrossRef] [Google Scholar]
- O’Dea, C. P. 1998, PASP, 110, 493 [NASA ADS] [CrossRef] [Google Scholar]
- O’Dea, C. P., & Baum, S. A. 1997, AJ, 113, 148 [NASA ADS] [CrossRef] [Google Scholar]
- Orienti, M., Dallacasa, D., Tinti, S., & Stanghellini, C. 2006, A&A, 450, 959 [NASA ADS] [CrossRef] [EDP Sciences] [Google Scholar]
- Owsianik, I., & Conway, J. E. 1998, A&A, 337, 69 [NASA ADS] [Google Scholar]
- Pasetto, A., Kraus, A., Mack, K.-H., Bruni, G., & Carrasco-González, C. 2016, A&A, 586, A117 [NASA ADS] [CrossRef] [EDP Sciences] [Google Scholar]
- Peck, A. B., & Taylor, G. B. 2000, ApJ, 534, 90 [NASA ADS] [CrossRef] [Google Scholar]
- Peck, A. B., Taylor, G. B., & Conway, J. E. 1999, ApJ, 521, 103 [Google Scholar]
- Pihlström, Y. M., Conway, J. E., & Vermeulen, R. C. 2003, A&A, 404, 871 [NASA ADS] [CrossRef] [EDP Sciences] [Google Scholar]
- Polatidis, A. G., & Conway, J. E. 2003, PASA, 20, 69 [Google Scholar]
- Rees, M. J. 1967, MNRAS, 136, 279 [NASA ADS] [CrossRef] [Google Scholar]
- Sanghera, H. S., Saikia, D. J., Luedke, E., et al. 1995, A&A, 295, 629 [NASA ADS] [Google Scholar]
- Slish, V. I. 1963, Nature, 199, 682 [NASA ADS] [CrossRef] [Google Scholar]
- Spencer, R. E., McDowell, J. C., Charlesworth, M., et al. 1989, MNRAS, 240, 657 [NASA ADS] [CrossRef] [Google Scholar]
- Stanghellini, C., O’Dea, C. P., Baum, S. A., et al. 1997, A&A, 325, 943 [Google Scholar]
- Stanghellini, C., Dallacasa, D., O’Dea, C. P., et al. 1998, in The Parsec-Scale Radio Polarization of Three GHz-Peaked-Spectrum Radio Sources, eds. J. A. Zensus, G. B. Taylor, & J. M. Wrobel, ASP Conf. Ser., 144, 177 [Google Scholar]
- Taylor, G. B., Inoue, M., & Tabara, H. 1992, A&A, 264, 421 [Google Scholar]
- Taylor, G. B., Readhead, A. C. S., & Pearson, T. J. 1996, ApJ, 463, 95 [NASA ADS] [CrossRef] [Google Scholar]
- Vermeulen, R. C., Ros, E., Kellermann, K. I., et al. 2003, A&A, 401, 113 [NASA ADS] [CrossRef] [EDP Sciences] [Google Scholar]
- Véron-Cetty, M. P., Woltjer, L., Staveley-Smith, L., & Ekers, R. D. 2000, A&A, 362, 426 [Google Scholar]
- Wilkinson, P. N., Polatidis, A. G., Readhead, A. C. S., Xu, W., & Pearson, T. J. 1994, ApJ, 432, L87 [Google Scholar]
- Wright, A., & Otrupcek, R. 1990, Parkes Catalog, 1990, Australia Telescope National Facility [Google Scholar]
- Xiang, L., Dallacasa, D., Cassaro, P., Jiang, D., & Reynolds, C. 2005, A&A, 434, 123 [NASA ADS] [CrossRef] [EDP Sciences] [Google Scholar]
- Xu, W., Readhead, A. C. S., Pearson, T. J., Polatidis, A. G., & Wilkinson, P. N. 1995, ApJS, 99, 297 [NASA ADS] [CrossRef] [Google Scholar]
- Zovaro, H. R. M., Sharp, R., Nesvadba, N. P. H., et al. 2019, MNRAS, 484, 3393 [NASA ADS] [CrossRef] [Google Scholar]
Appendix A: Additional tables
GPS and CSS sources with HI detection used in Fig. 4, compiled from various sources in the literature.
GPS and CSS sources with no detected HI detection used in Fig. 4, compiled from various sources in the literature.
All Tables
GPS and CSS sources with HI detection used in Fig. 4, compiled from various sources in the literature.
GPS and CSS sources with no detected HI detection used in Fig. 4, compiled from various sources in the literature.
All Figures
|
Fig. 1. uGMRT stokes-I image of source J1209−2032 at 1011.7 MHz. The contours are drawn at 3, 4, 8, 16, 32, 64, 128, 256, 512, 1024, and 2048 times the image rms noise, which is 0.8 mJy. The beam size is 4.3″ × 2.7″ (position angle = −35°). |
| In the text | |
|
Fig. 2. Stokes-I 21-cm absorption spectra toward J1209−2032. The spectrum was smoothed over five consecutive spectral channels to improve the signal-to-noise ratio, and normalized with respect to the peak flux density. The spectral resolution and rms noise in the smoothed spectra are 0.9 km s−1 and 1.9 mJy beam−1 channel−1, respectively. |
| In the text | |
|
Fig. 3. Stokes-I 21-cm absorption spectra toward J1549+5038. The spectrum was smoothed over five consecutive spectral channels and normalized with respect to the peak flux density. The spectral resolution and rms noise in the smoothed spectra are 2.0 km s−1 and 3.1 mJy beam−1 channel−1, respectively. The feature at 200 km s−1 that looks like emission is due to weak RFI present only in LL. |
| In the text | |
|
Fig. 4. Various spectral parameters for present sample of GPS and CSS sources plotted against their linear sizes, with the superposition of EISERS J1209−2032 and J1549+5038 (star symbol). The filled circles represent GPS sources, and the square symbol represents CSS sources. The error bars for the source J1209−2032 are of the order of the symbol size. |
| In the text | |
Current usage metrics show cumulative count of Article Views (full-text article views including HTML views, PDF and ePub downloads, according to the available data) and Abstracts Views on Vision4Press platform.
Data correspond to usage on the plateform after 2015. The current usage metrics is available 48-96 hours after online publication and is updated daily on week days.
Initial download of the metrics may take a while.