Fig. 6.
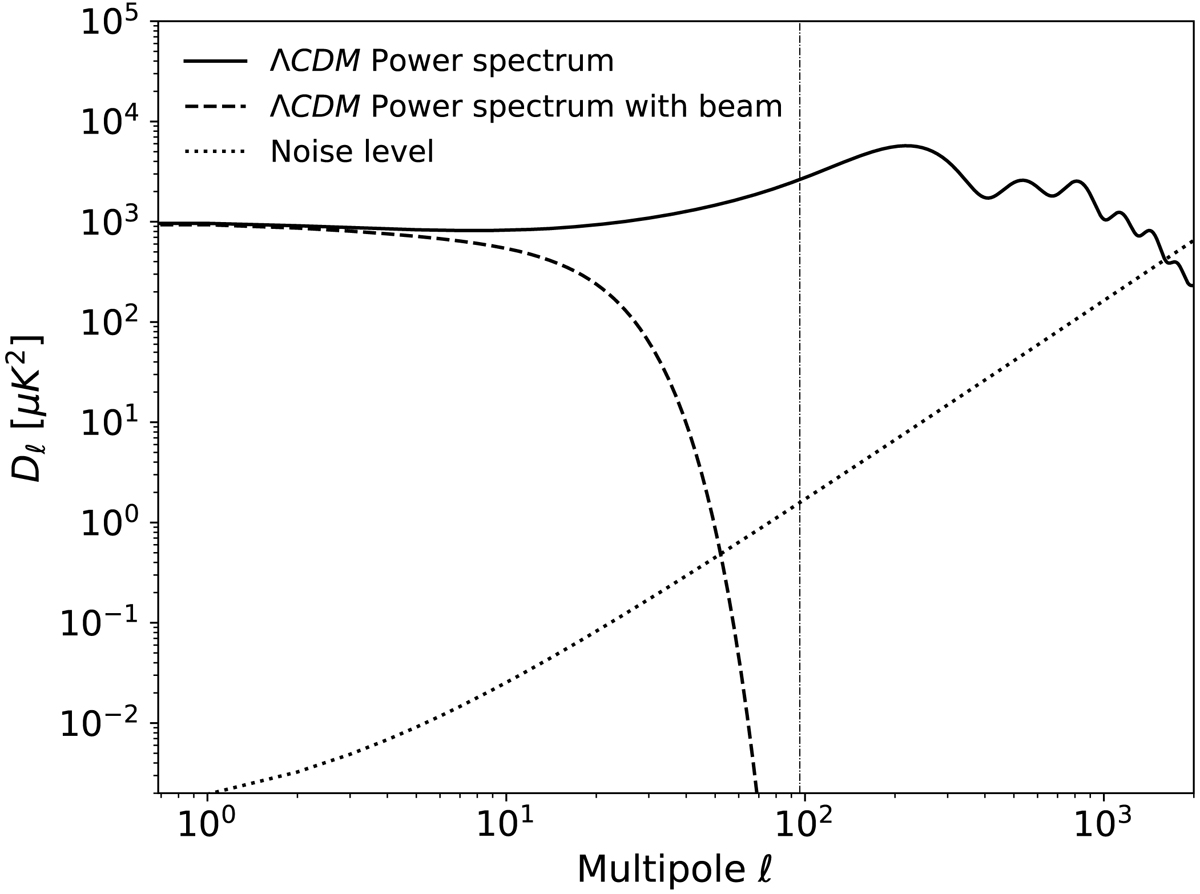
Overview of signal and noise power spectra adopted for the Monte Carlo simulations. The solid line shows the best-fit PlanckΛCDM power spectrum, and the dashed line shows the same, but convolved with a 6° FWHM Gaussian beam. The dotted line shows the noise spectrum for white uncorrelated noise with σ0 = 1 μK per pixel at a HEALPix resolution of Nside = 32. The vertical dotted line shows the harmonic space truncation limit of ℓmax = 95.
Current usage metrics show cumulative count of Article Views (full-text article views including HTML views, PDF and ePub downloads, according to the available data) and Abstracts Views on Vision4Press platform.
Data correspond to usage on the plateform after 2015. The current usage metrics is available 48-96 hours after online publication and is updated daily on week days.
Initial download of the metrics may take a while.