Fig. 10.
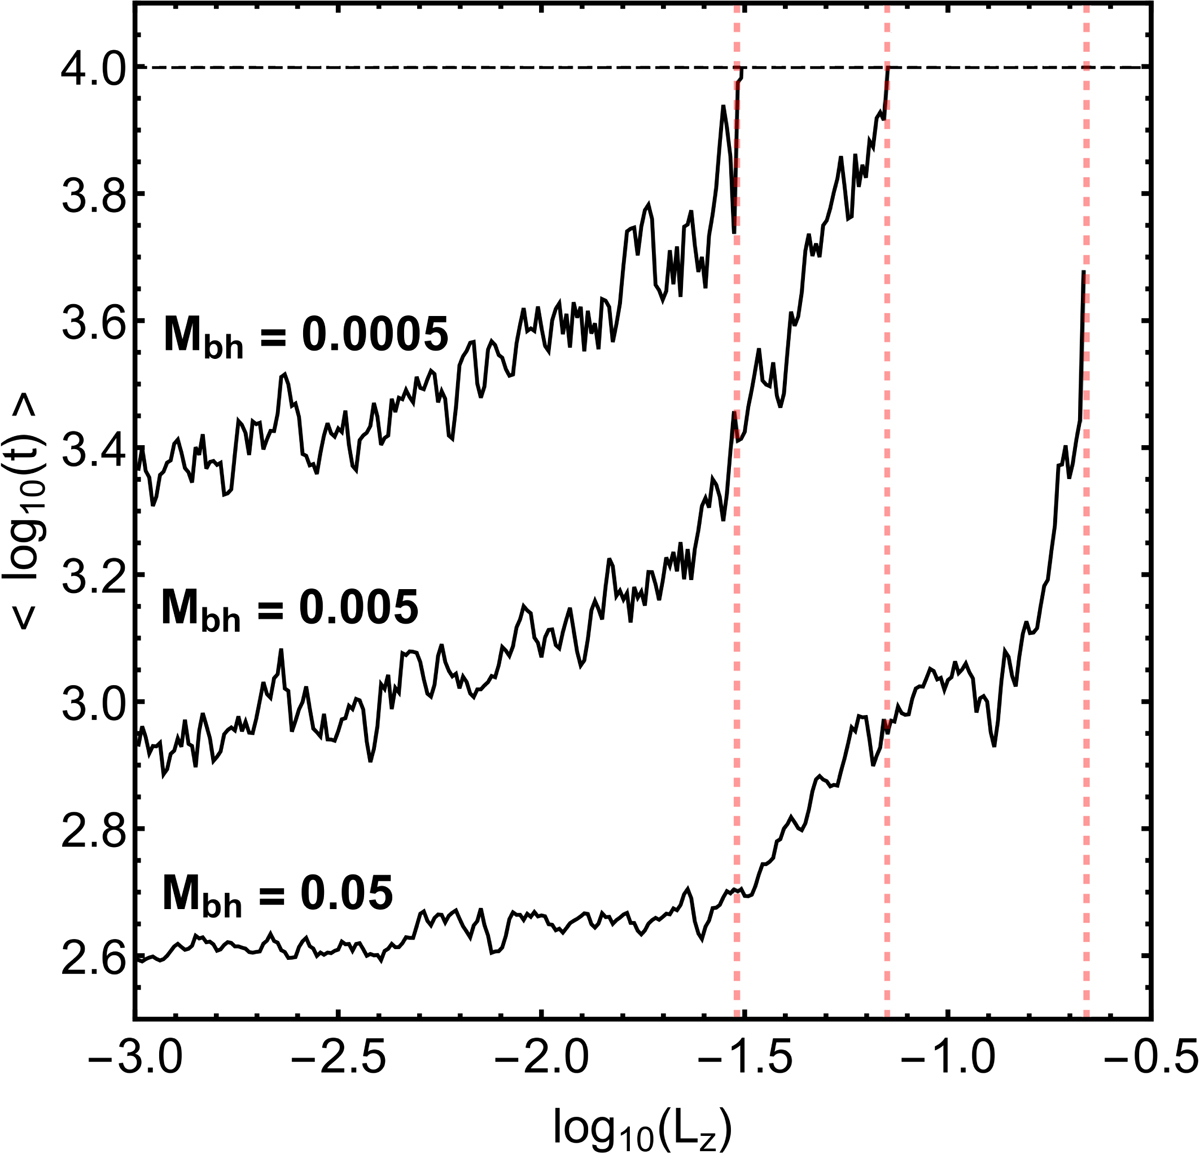
Evolution of the average collision time of the trajectories, with initial conditions on the (R, Lz) plane, as a function of the angular momentum. The horizontal black dashed line indicates the total time of the numerical integration, while the vertical red dashed lines denote the maximum value of Lz, for which the ZVCs are open.
Current usage metrics show cumulative count of Article Views (full-text article views including HTML views, PDF and ePub downloads, according to the available data) and Abstracts Views on Vision4Press platform.
Data correspond to usage on the plateform after 2015. The current usage metrics is available 48-96 hours after online publication and is updated daily on week days.
Initial download of the metrics may take a while.