Fig. A.1
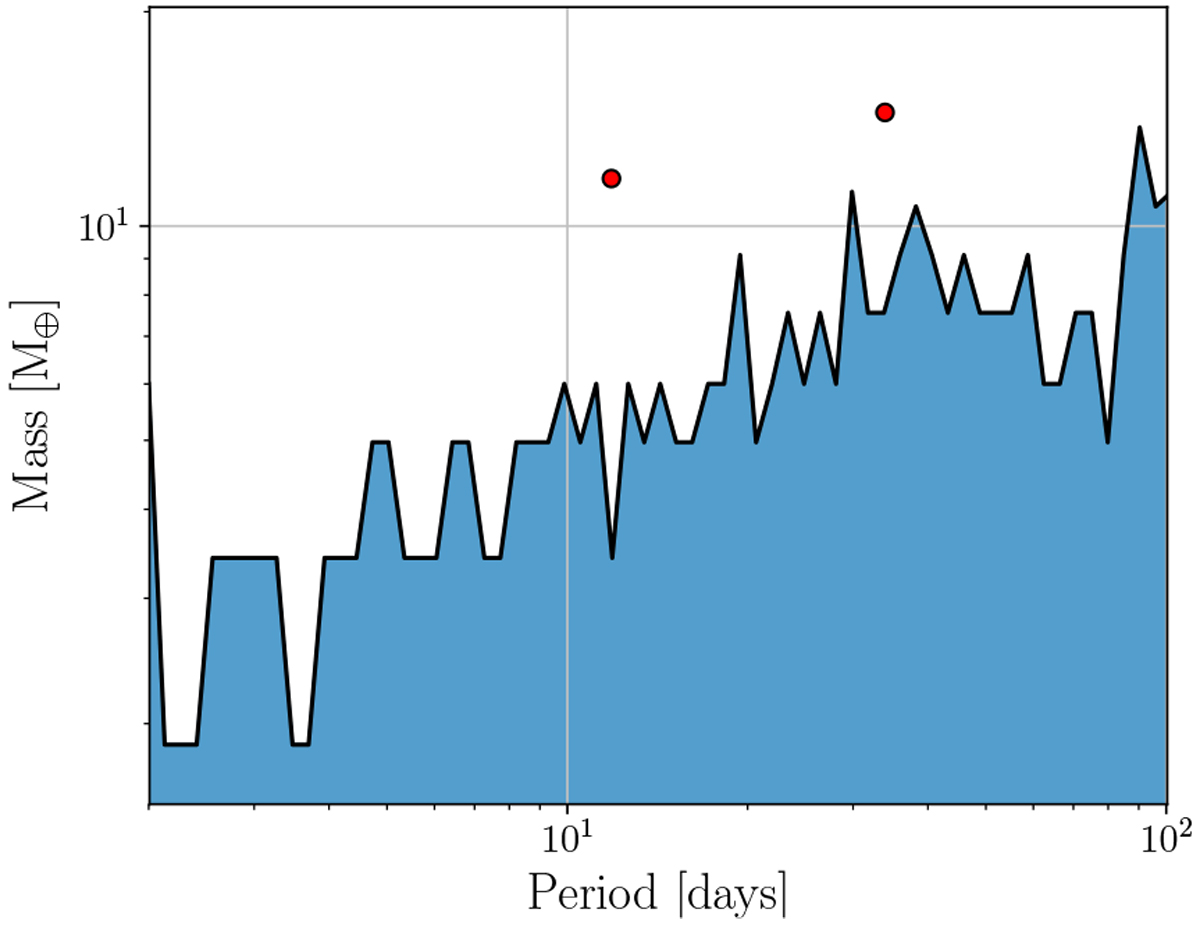
Mass–detection limit curve (calculated according to the LPA method (Meunier et al. 2012) of the planetary system HD 20003 with its two confirmed planets (Udry et al. 2019). We approximate the planet detection probability for this star (pS = 0.48) as the ratio between the area above its mass detection limit curve (white area) and the total area of the rectangle in the period-mass range of 2–100 days and 1–20 M⊕.
Current usage metrics show cumulative count of Article Views (full-text article views including HTML views, PDF and ePub downloads, according to the available data) and Abstracts Views on Vision4Press platform.
Data correspond to usage on the plateform after 2015. The current usage metrics is available 48-96 hours after online publication and is updated daily on week days.
Initial download of the metrics may take a while.