Fig. 5
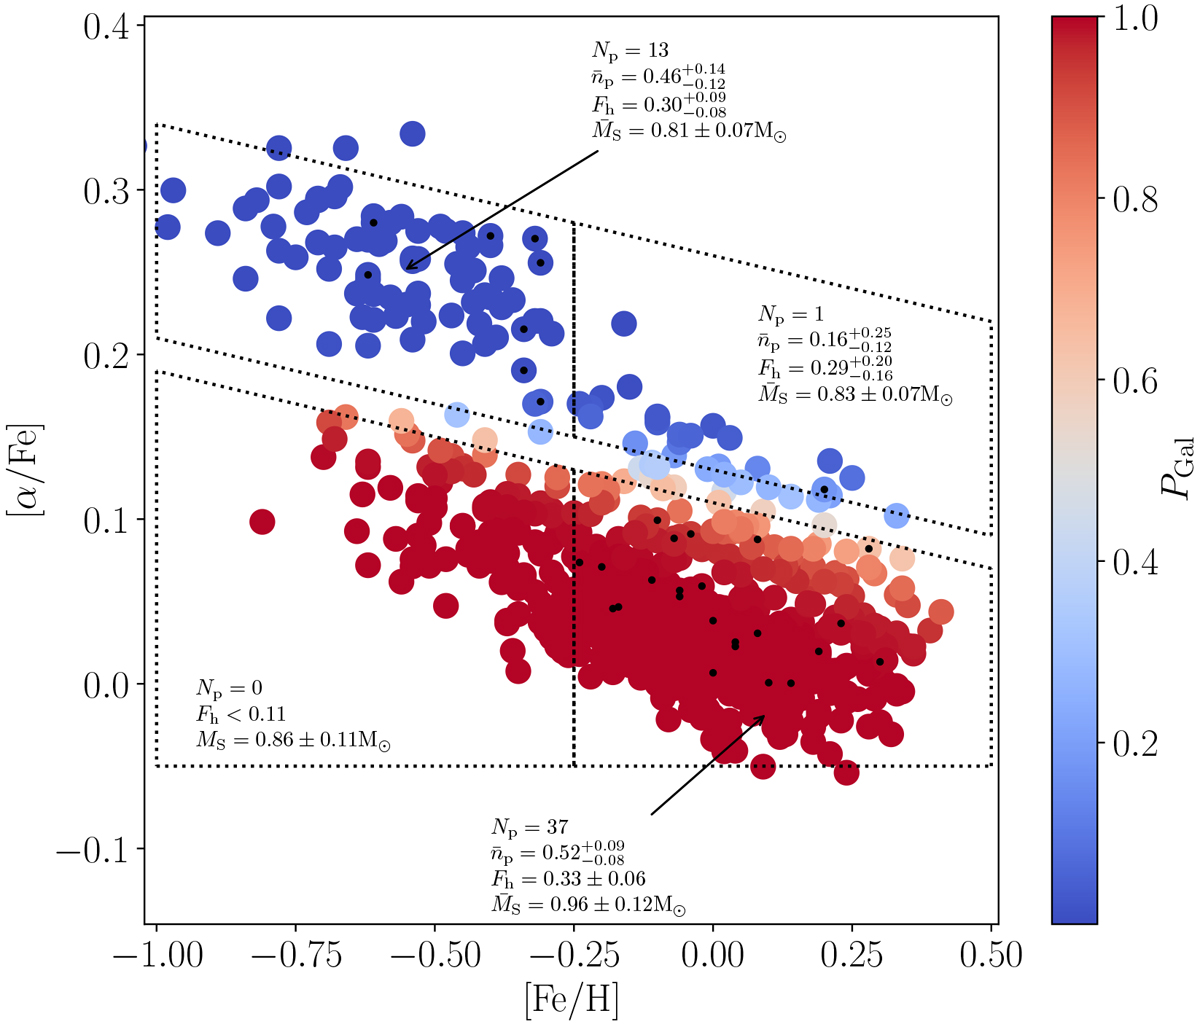
Scatter plot of the stellar sample on the [α/Fe]-[Fe/H] plane (similar to Fig. 1). Red circles represent thin-disk stars while blue circles represent thick-disk stars. Close-in small planet-host stars are marked by black dots. The division into four regions is based on cutting at [Fe/H] = −0.25 dex in addition to the division into thin and thick disks. For each region, we have marked the number and occurrence rates of detected close-in small planets as well as the detectability-weighted means of the stellar mass sample.
Current usage metrics show cumulative count of Article Views (full-text article views including HTML views, PDF and ePub downloads, according to the available data) and Abstracts Views on Vision4Press platform.
Data correspond to usage on the plateform after 2015. The current usage metrics is available 48-96 hours after online publication and is updated daily on week days.
Initial download of the metrics may take a while.