Free Access
Fig. 3
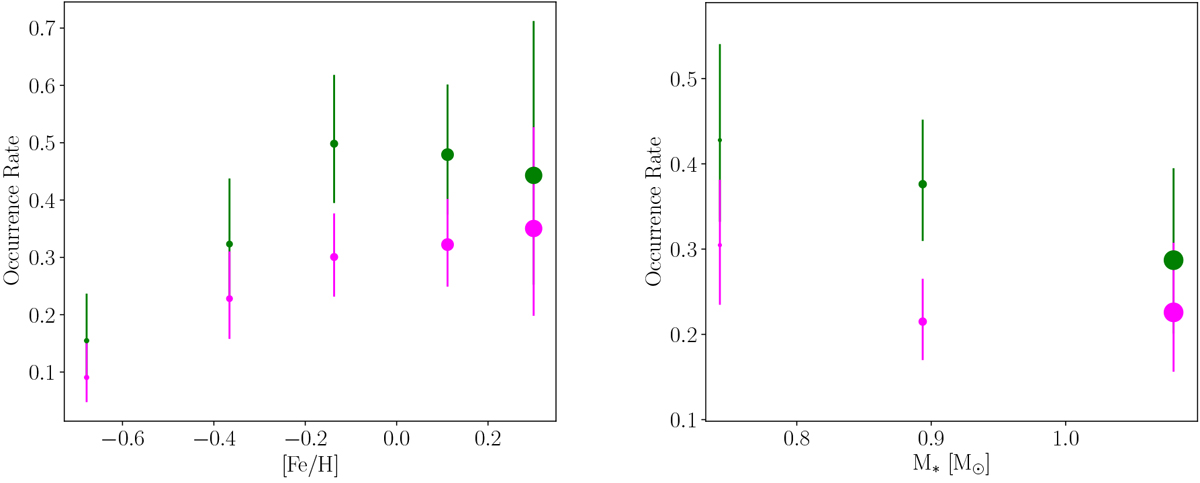
Close-in (P < 100 days) small planet (Mp sin i < 30 M⊕) occurrence rates: average number of planets per star (![]() ) in green, fraction of stars with planets (Fh) in magenta as a function of [Fe/H] (left panel) and stellar mass (right panel). The circle sizes represent the mean stellar mass of the relevant bin.
) in green, fraction of stars with planets (Fh) in magenta as a function of [Fe/H] (left panel) and stellar mass (right panel). The circle sizes represent the mean stellar mass of the relevant bin.
Current usage metrics show cumulative count of Article Views (full-text article views including HTML views, PDF and ePub downloads, according to the available data) and Abstracts Views on Vision4Press platform.
Data correspond to usage on the plateform after 2015. The current usage metrics is available 48-96 hours after online publication and is updated daily on week days.
Initial download of the metrics may take a while.