Fig. 8.
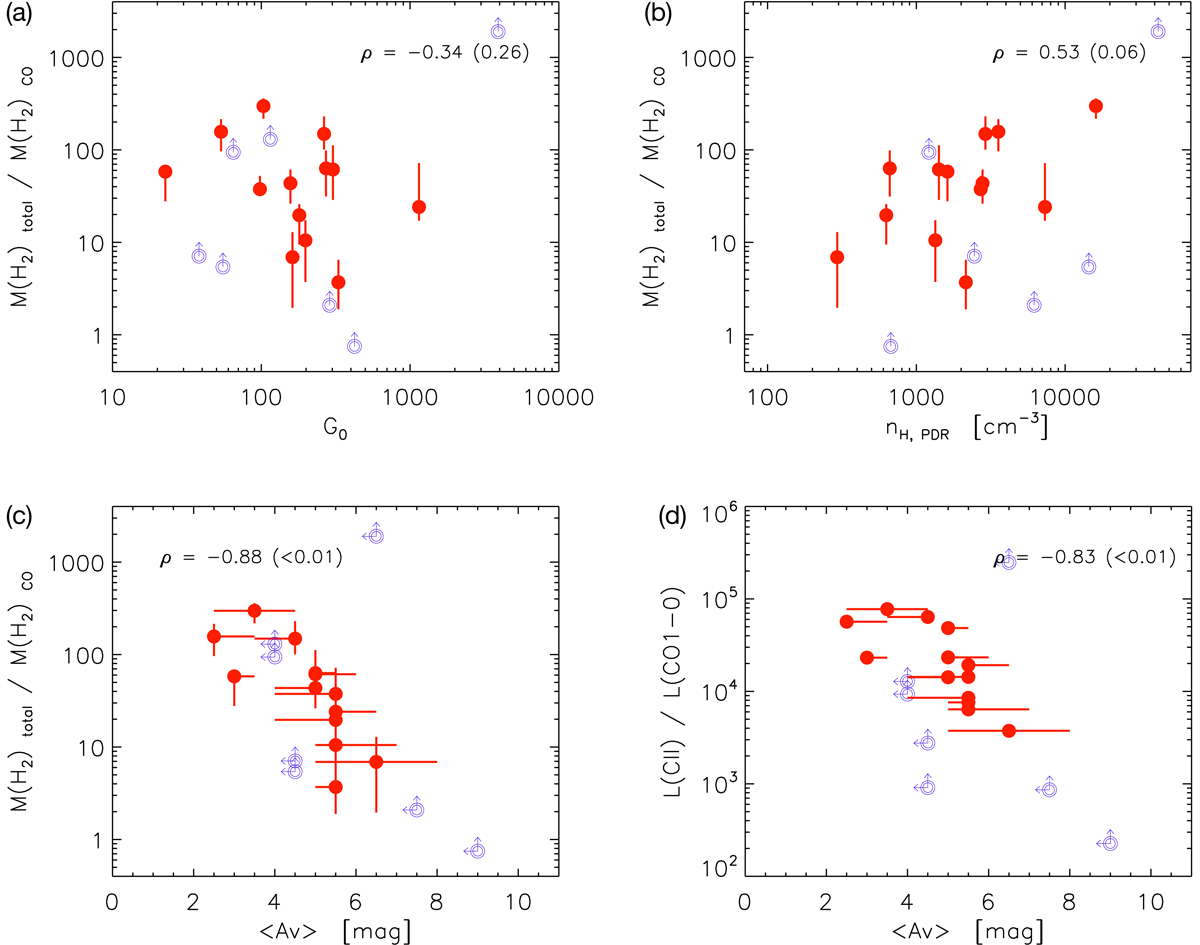
Results from applying the models to the DGS sample and trends with model parameters. The vertical axis in panels a–c is M(H2)total/M(H2)CO (the ratio of the total MH2 determined from the model and the CO-bright MH2 determined from CO observations and the Galactic conversion factor) versus, on the horizontal axis, (a) G0, (b) density, and (c) AV. d: observed L[C II]/LCO(1−0) vs. model AV. Spearman correlation coefficients (ρ) and p-values in parenthesis are indicated within each panel. Red points are solutions for the DGS galaxies with CO detections. Open symbols are upper limits due to CO non-detections. The masses determined by the model for the individual galaxies have been scaled by their proper LTIR.
Current usage metrics show cumulative count of Article Views (full-text article views including HTML views, PDF and ePub downloads, according to the available data) and Abstracts Views on Vision4Press platform.
Data correspond to usage on the plateform after 2015. The current usage metrics is available 48-96 hours after online publication and is updated daily on week days.
Initial download of the metrics may take a while.