Fig. 5
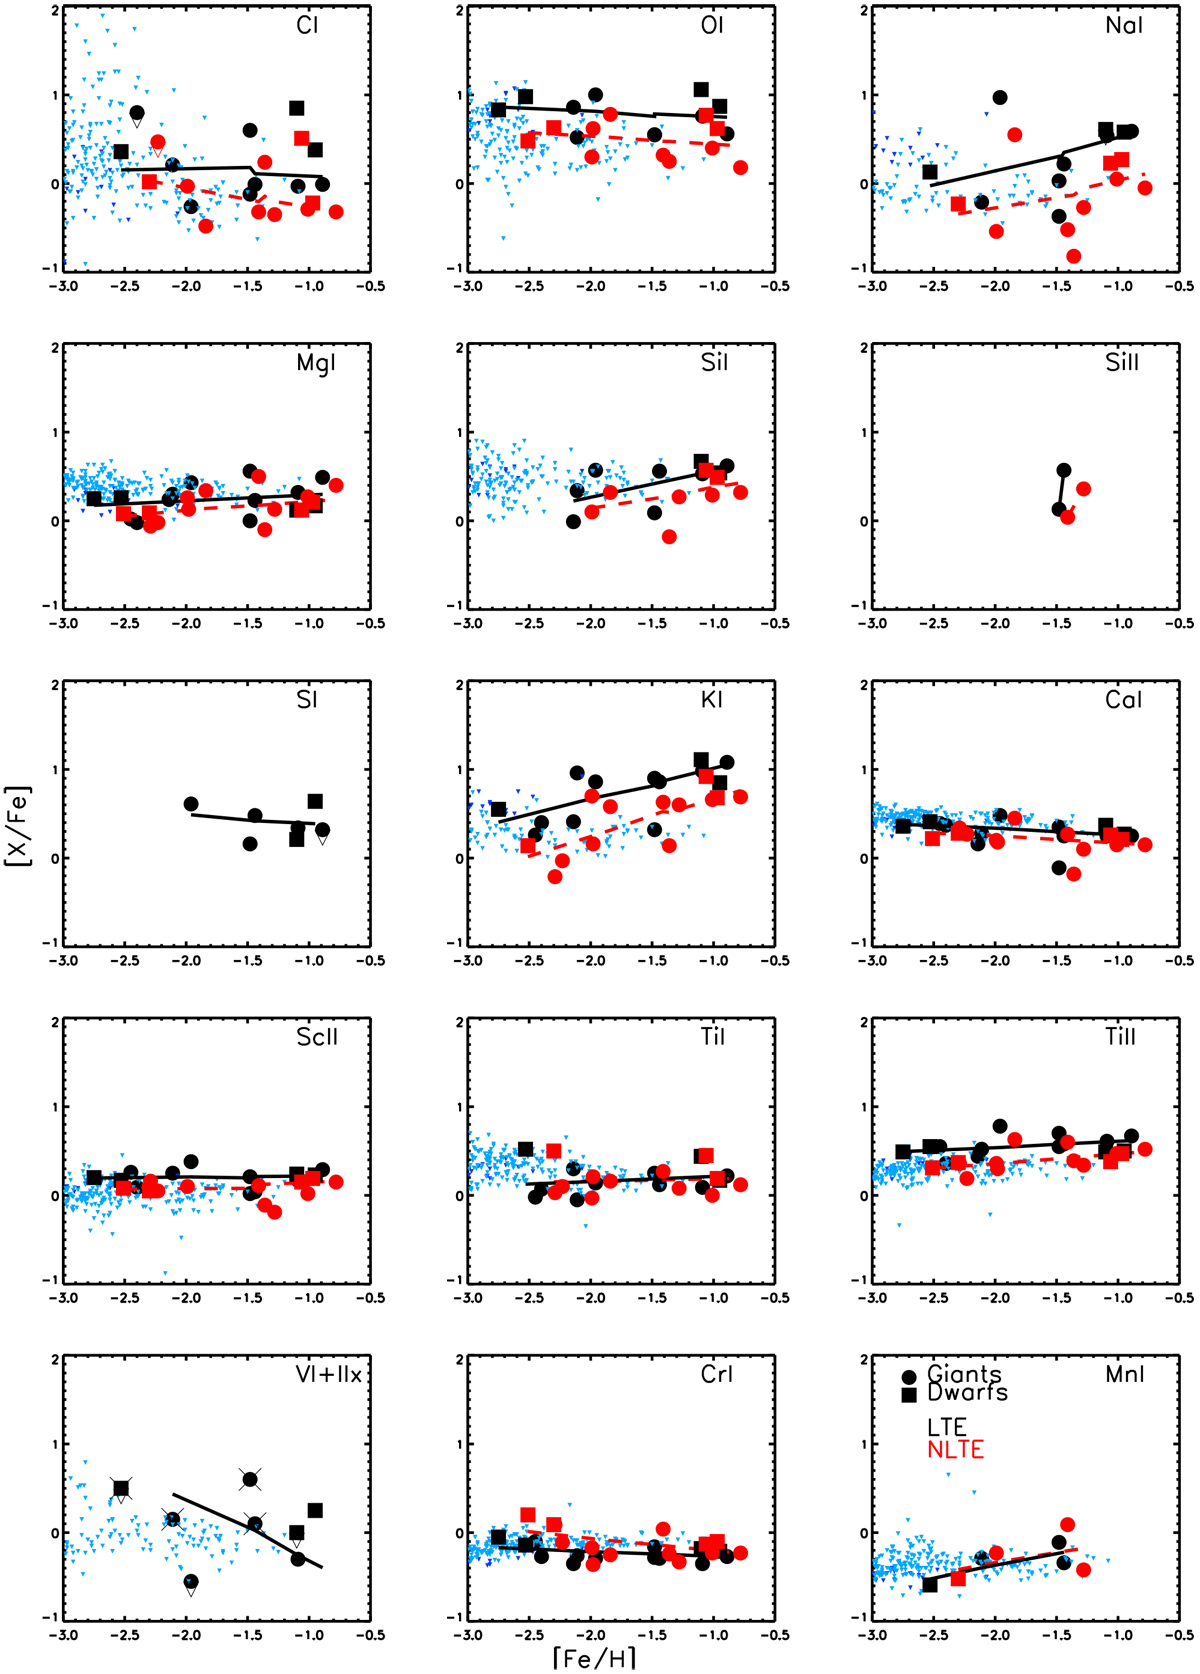
Relative abundances [X/Fe] versus [Fe/H] of element (X) up to Mn. LTE abundances are illustrated by black filled symbols, while NLTE abundances are shown as red symbols, with giants depicted as circles and dwarfs as squares. The “x” in the vanadium panel indicates stars for which we measured VII rather than VI. LOWESS trends are indicated for LTE (black solid line) and NLTE (red dashed line). In blue, we show the abundances from Cayrel et al. (2004) and Roederer et al. (2014).
Current usage metrics show cumulative count of Article Views (full-text article views including HTML views, PDF and ePub downloads, according to the available data) and Abstracts Views on Vision4Press platform.
Data correspond to usage on the plateform after 2015. The current usage metrics is available 48-96 hours after online publication and is updated daily on week days.
Initial download of the metrics may take a while.