Fig. A.1
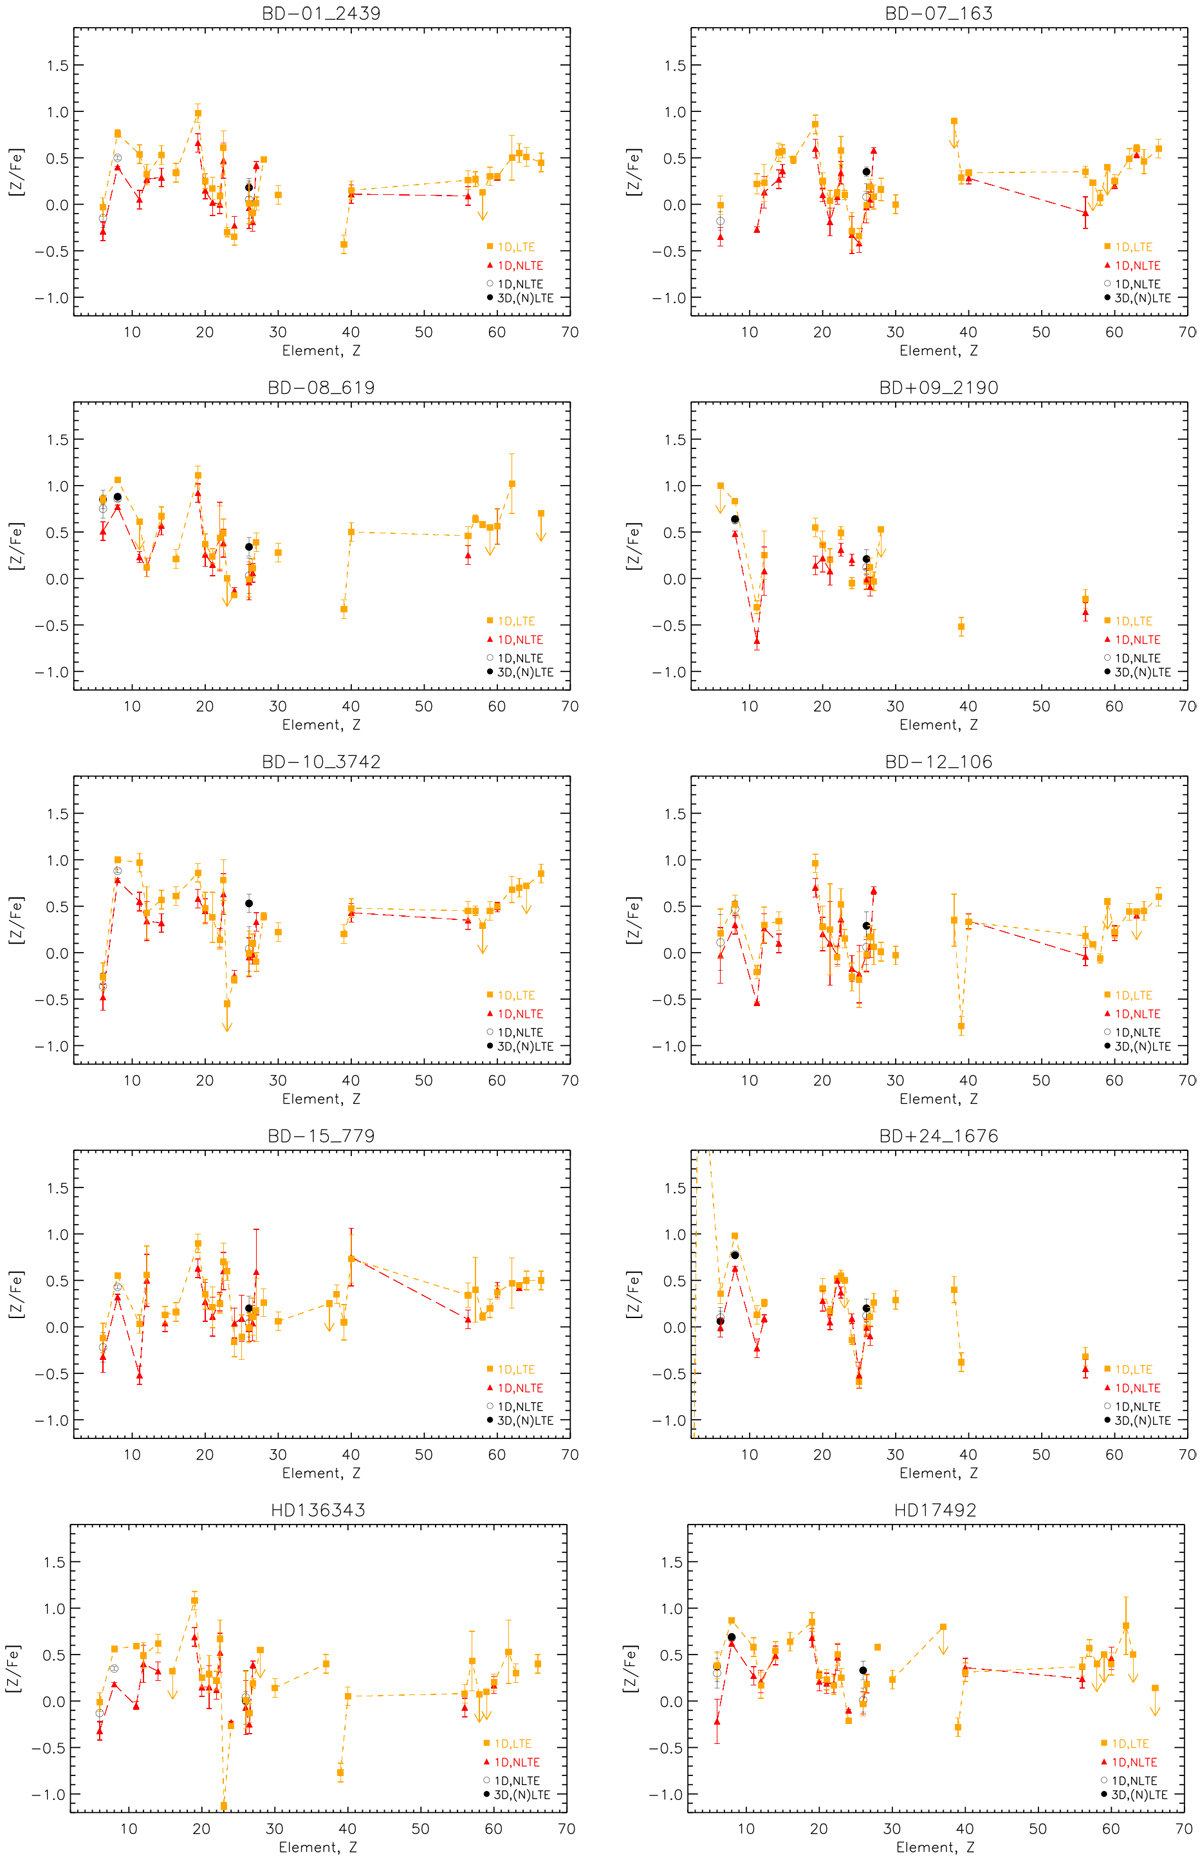
Abundance patterns in 1D LTE (yellow squares), 1D NLTE (red triangles with corrections as listed in Table 3 with the exception of C, which in the red triangles are based on Alexeeva & Mashonkina (2015)), and 1D NLTE and 3D NLTE for C and O (in black), while 3D LTE is shown for Fe (corrections from Amarsi et al. 2019b,c, as described in Sect. 4.3).
Current usage metrics show cumulative count of Article Views (full-text article views including HTML views, PDF and ePub downloads, according to the available data) and Abstracts Views on Vision4Press platform.
Data correspond to usage on the plateform after 2015. The current usage metrics is available 48-96 hours after online publication and is updated daily on week days.
Initial download of the metrics may take a while.