Fig. 5.
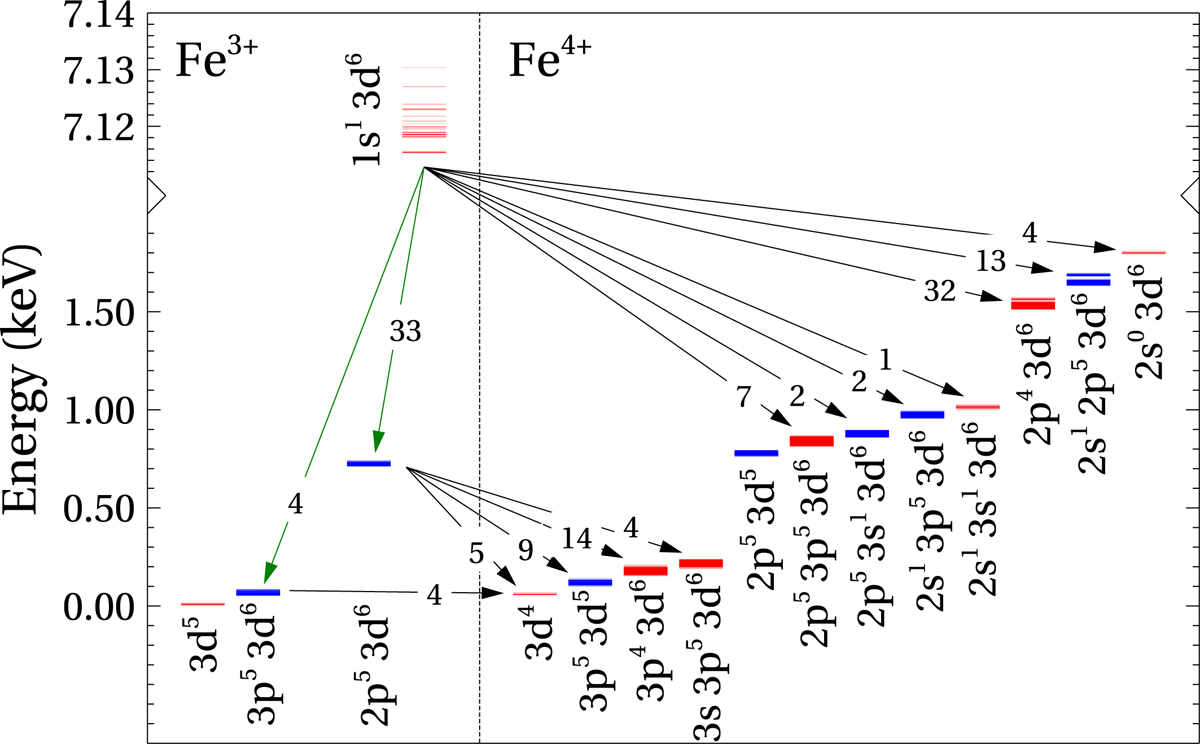
Main branches of radiative and Auger cascade following decay of the Fe3+ 1s13d6 configuration. The decay branches are presented for the configurations of the Fe3+ ion. The initial population of the levels is proportional to their statistical weights. The numbers near the arrows indicate the branching ratios in percent. Even configurations are shown with a red color, and odd configurations are shown with a blue color.
Current usage metrics show cumulative count of Article Views (full-text article views including HTML views, PDF and ePub downloads, according to the available data) and Abstracts Views on Vision4Press platform.
Data correspond to usage on the plateform after 2015. The current usage metrics is available 48-96 hours after online publication and is updated daily on week days.
Initial download of the metrics may take a while.