Fig. 7.
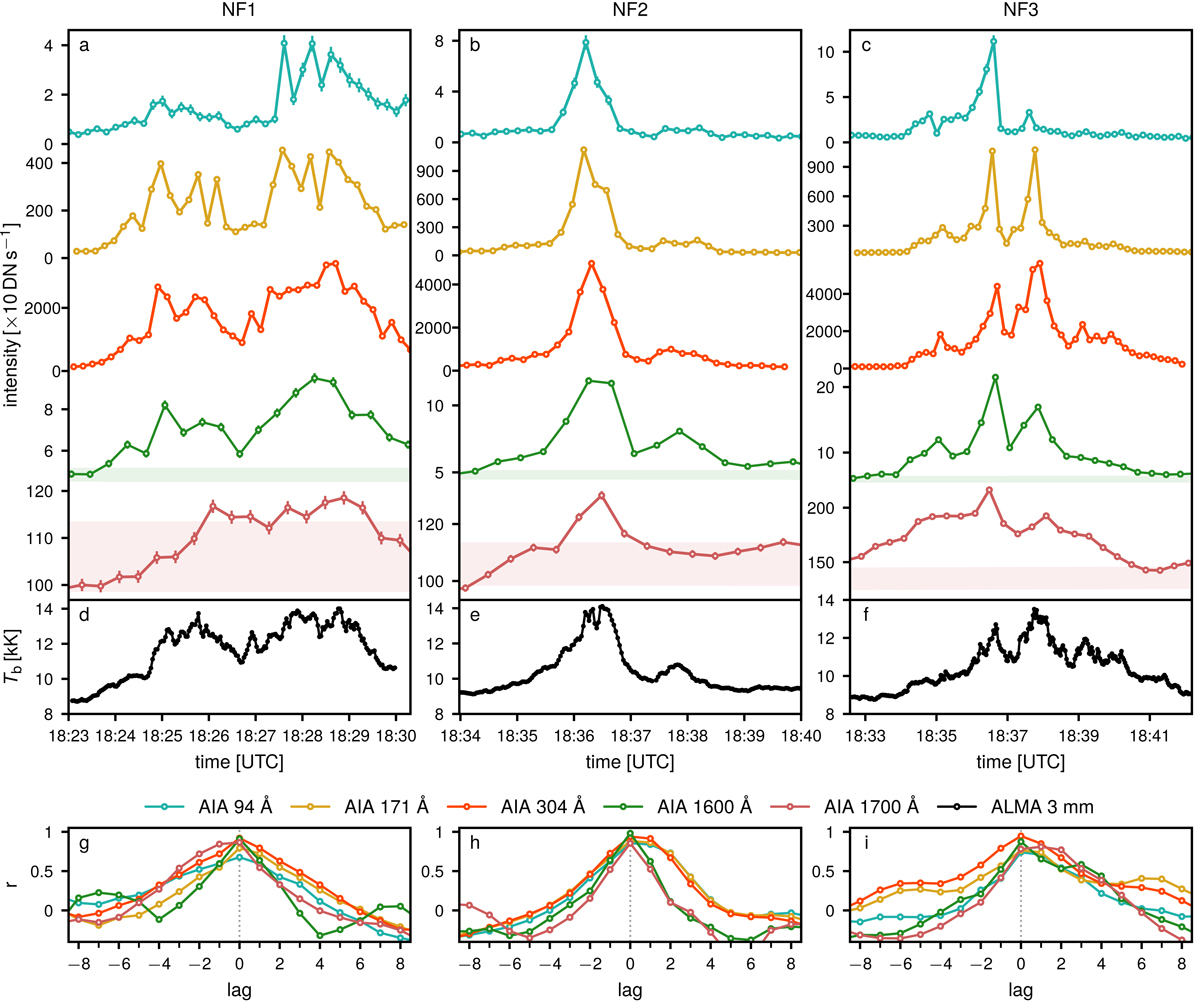
AIA and ALMA light curves. Panels a–c: intensity as function of time in different AIA passbands at the three nanoflares shown in Fig. 4; the shaded areas in the 1600 Å and 1700 Å panels enclose the mean ±1σ of the (detrended) signal over a longer period of time. Panels d–f: corresponding mm brightness temperature. Panels g–i: cross-correlation functions between ALMA and AIA; one lag unit corresponds to 12 s in the EUV and 24 s in the UV.
Current usage metrics show cumulative count of Article Views (full-text article views including HTML views, PDF and ePub downloads, according to the available data) and Abstracts Views on Vision4Press platform.
Data correspond to usage on the plateform after 2015. The current usage metrics is available 48-96 hours after online publication and is updated daily on week days.
Initial download of the metrics may take a while.