Fig. 6.
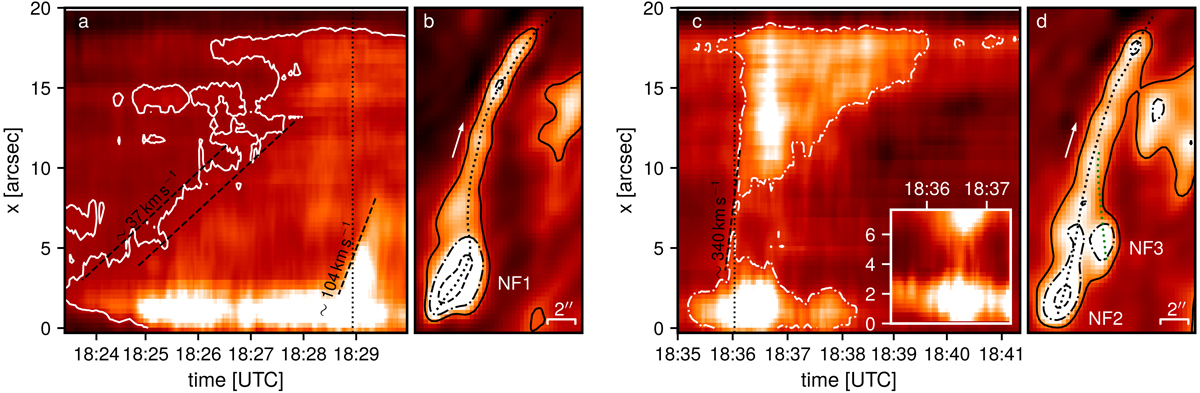
Space-time diagrams for selected nanoflares and associated bright loops in the mm continuum. Panels a and c: space-time plots along the dotted lines in panels b and d which in turn show ALMA Tb maps at two instances of time marked by the vertical dotted lines in the corresponding panels a and c. The contours correspond to 9, 10, 12 kK (solid, dot-dashed, dashed). The inset in panel c shows a space-time plot for the green path in panel d. The space-time panels are saturated at 10 kK. The dashed lines correspond to projected velocities of 37 km s−1 and 104 km s−1 in the first event, and ∼340 km s−1 in the second event.
Current usage metrics show cumulative count of Article Views (full-text article views including HTML views, PDF and ePub downloads, according to the available data) and Abstracts Views on Vision4Press platform.
Data correspond to usage on the plateform after 2015. The current usage metrics is available 48-96 hours after online publication and is updated daily on week days.
Initial download of the metrics may take a while.