Fig. 2.
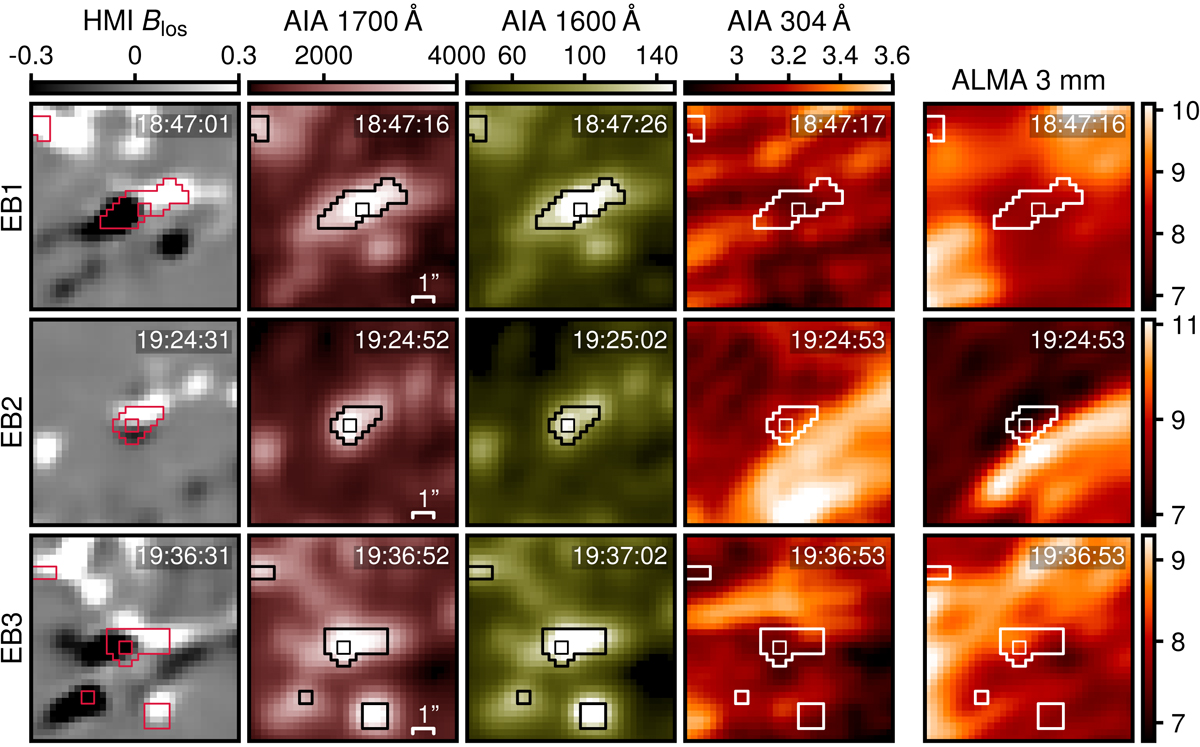
Examples of EB candidates in SDO and ALMA. From left to right: HMI magnetogram, spectral radiance in AIA 1700 Å, AIA 1600 Å, and AIA 304 Å, and ALMA 3 mm brightness temperature. All panels show a 10″ × 10″ FOV centered on EBs. The contours correspond to 5σ (thick) and 9σ (thin) EBDETECT thresholds (Sect. 3.1). The image scale is indicated in the panels in the second column. The range in the HMI magnetograms is clipped at ±0.3 kG and the AIA images are capped at 4500 DN s−1 (1700 Å), 150 DN s−1 (1600 Å) and 4000 DN s−1 (304 Å). The 304 Å images are displayed in logarithmic scale. The ALMA color bars are in units of kilokelvin. Additional examples are shown in the supplementary Fig. B.1.
Current usage metrics show cumulative count of Article Views (full-text article views including HTML views, PDF and ePub downloads, according to the available data) and Abstracts Views on Vision4Press platform.
Data correspond to usage on the plateform after 2015. The current usage metrics is available 48-96 hours after online publication and is updated daily on week days.
Initial download of the metrics may take a while.