Fig. B.1.
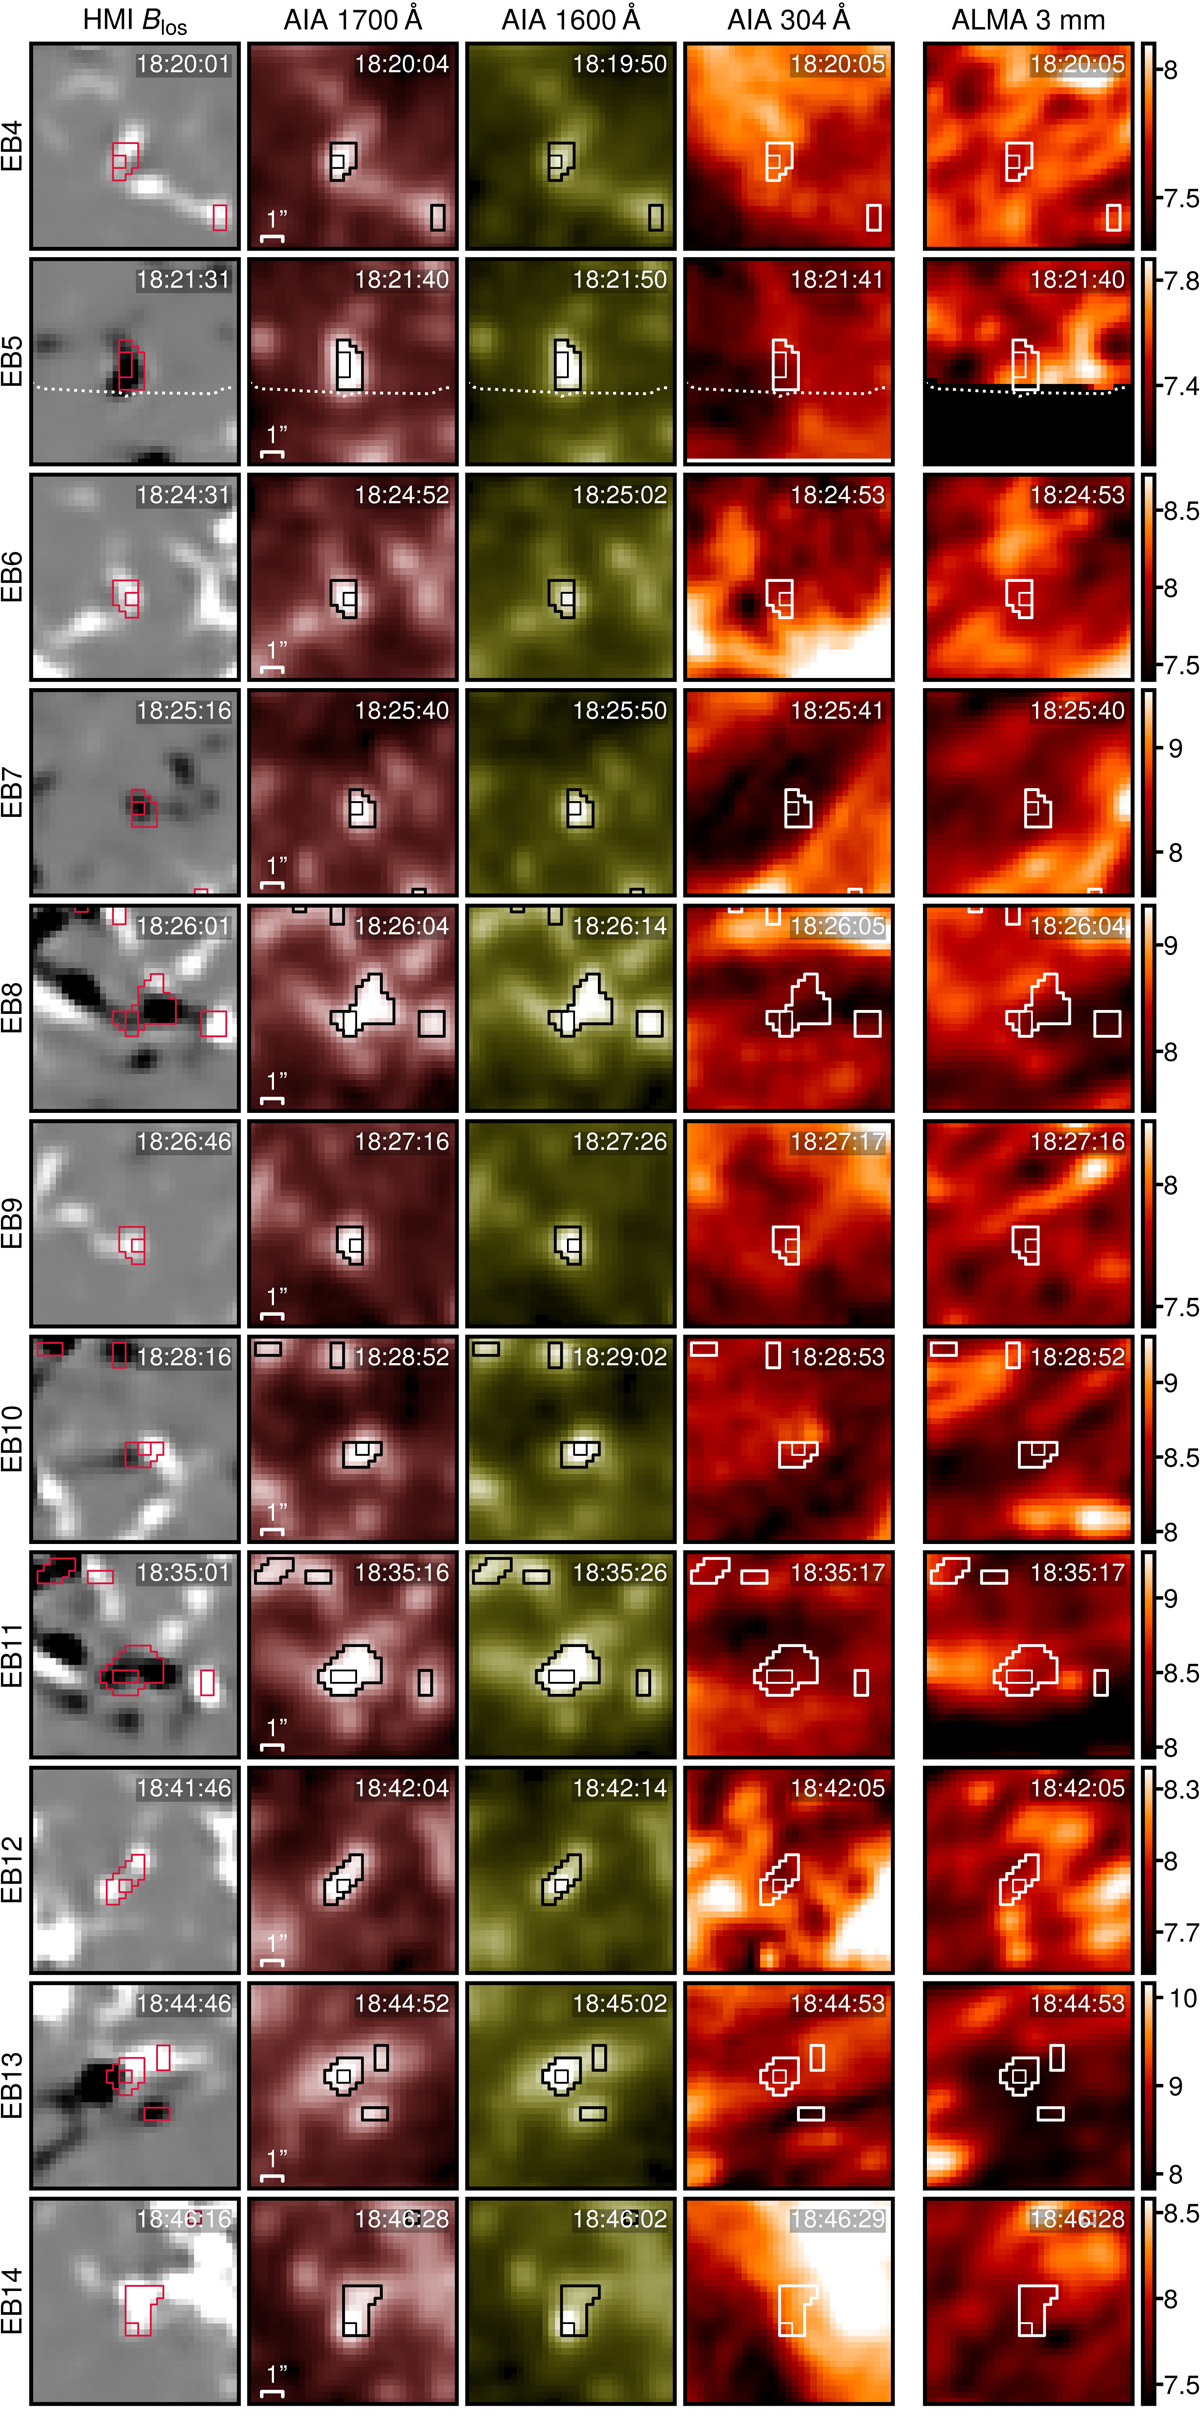
EB candidates in SDO and ALMA. All panels show a 10″ × 10″ FOV centered on EBs. The contours correspond to 5σ (thick) and 9σ (thin) EBDETECT thresholds (see Sect. 3.1). Only the 9σ events are considered as EBs. The image scale is indicated in the panels in the second column. The dotted lines in the second row delimit the edge of the ALMA field of view. The range in the HMI magnetograms is clipped at ±0.3 kG and the intensities in the AIA 1700 Å, 1600 Å and 304 Å channels are capped at 4000 DN s−1, 150 DN s−1, and 3000 DN s−1 in all panels. The ALMA color bars are in units of kilokelvin.
Current usage metrics show cumulative count of Article Views (full-text article views including HTML views, PDF and ePub downloads, according to the available data) and Abstracts Views on Vision4Press platform.
Data correspond to usage on the plateform after 2015. The current usage metrics is available 48-96 hours after online publication and is updated daily on week days.
Initial download of the metrics may take a while.