Free Access
Fig. A.1.
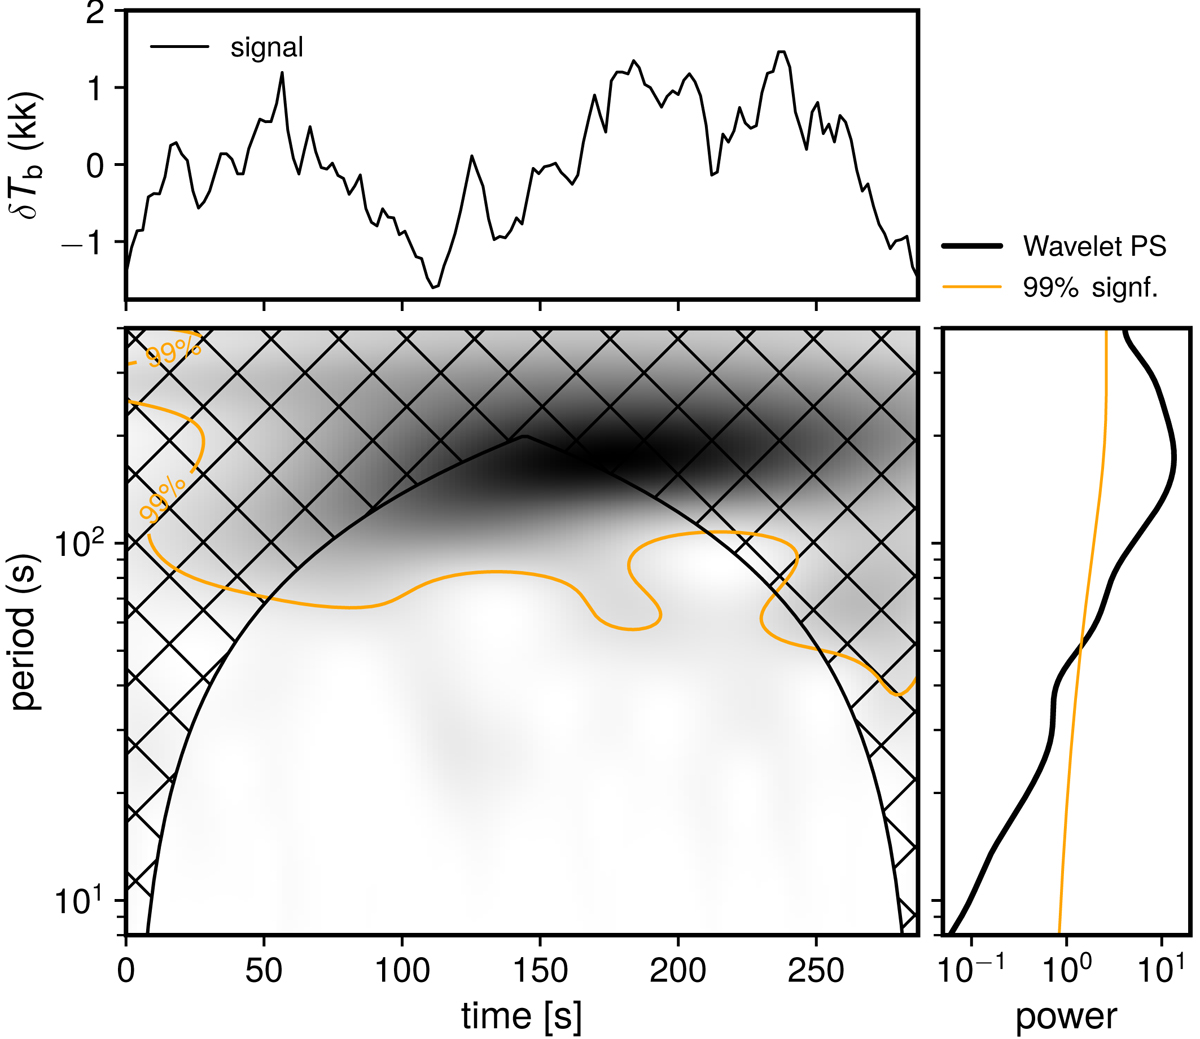
Time-frequency domain analysis for NF1. The scalogram is shown in inverse color. The hatch is the cone of influence. The 99% confidence regions are shown by the yellow lines. The global wavelet power spectrum (PS) and global significant level are shown in the right panel.
Current usage metrics show cumulative count of Article Views (full-text article views including HTML views, PDF and ePub downloads, according to the available data) and Abstracts Views on Vision4Press platform.
Data correspond to usage on the plateform after 2015. The current usage metrics is available 48-96 hours after online publication and is updated daily on week days.
Initial download of the metrics may take a while.