Fig. 11.
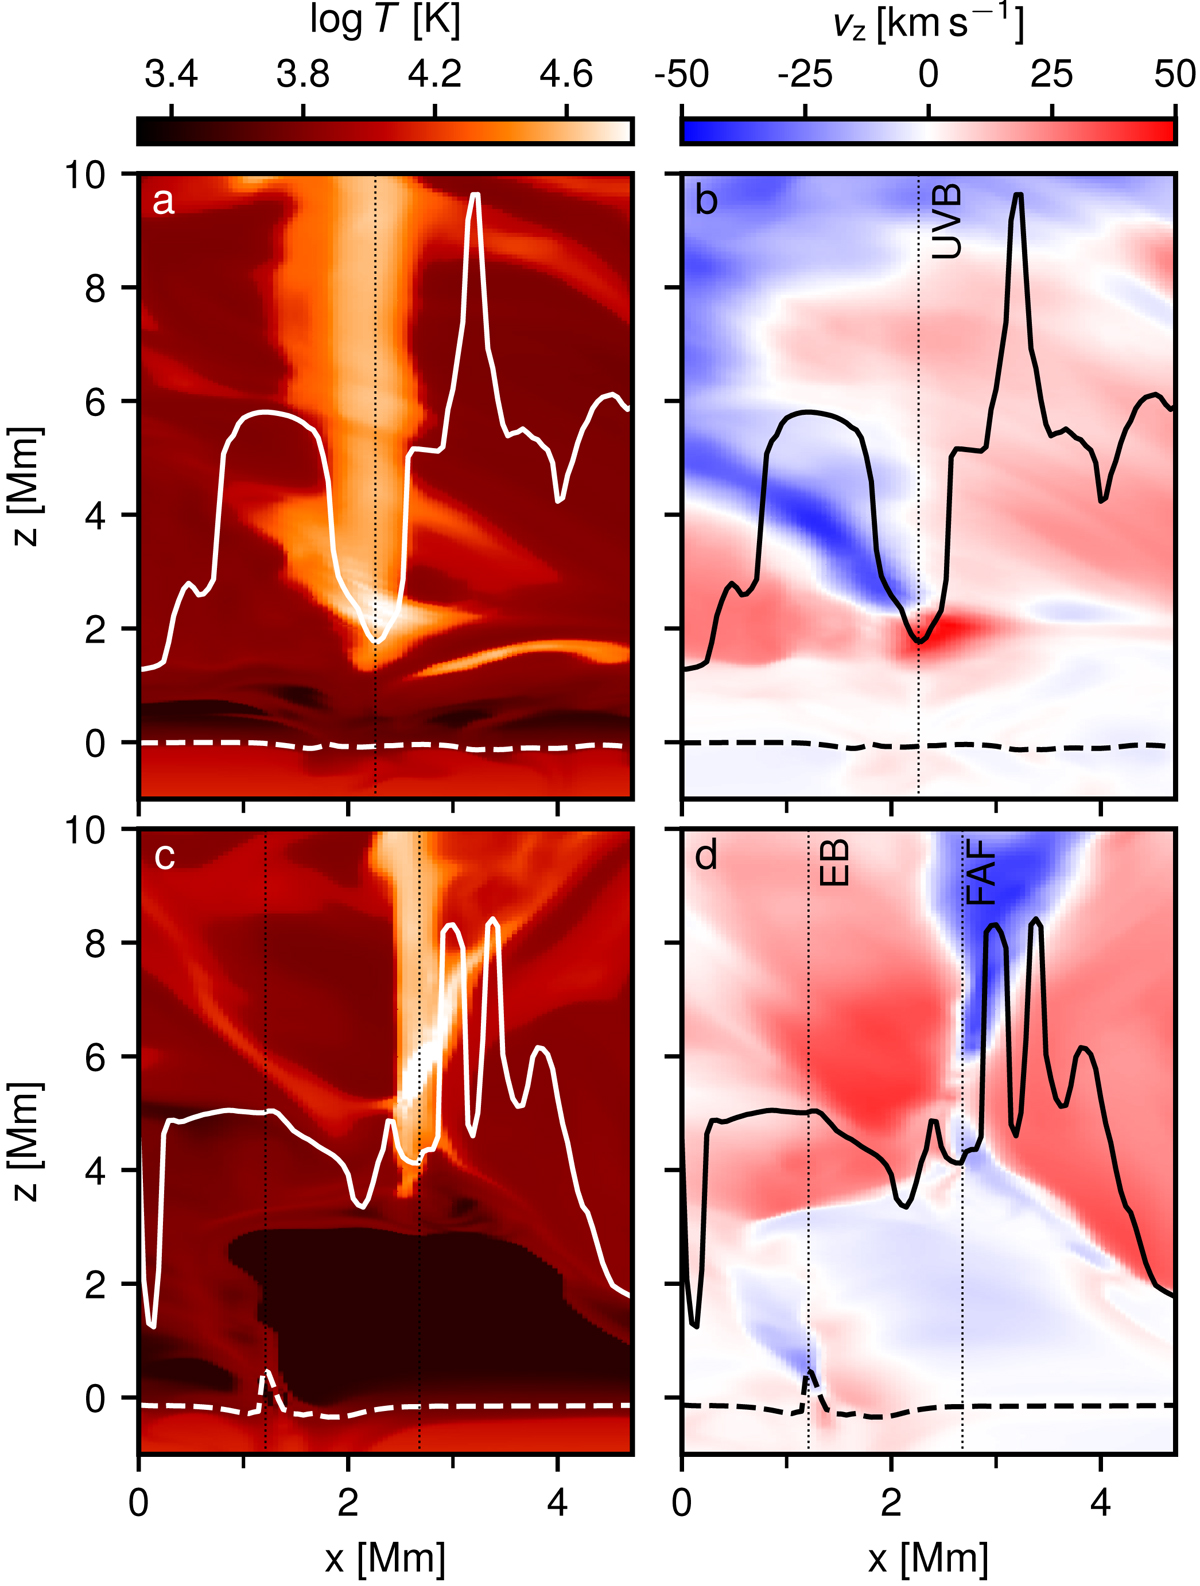
Vertical cuts through the simulation box at the location of reconnection events. Top row: cut through the UV burst; bottom row: cut through the EB and a FAF. Left-hand column: temperature, the right-hand column the vertical velocity. The τ = 1 layer of Hα-1.5 Å (dashed) and 3 mm (solid) radiation are shown in all panels. The thin dotted lines indicate the locations of the EB, UVB, and FAF.
Current usage metrics show cumulative count of Article Views (full-text article views including HTML views, PDF and ePub downloads, according to the available data) and Abstracts Views on Vision4Press platform.
Data correspond to usage on the plateform after 2015. The current usage metrics is available 48-96 hours after online publication and is updated daily on week days.
Initial download of the metrics may take a while.