Fig. 10.
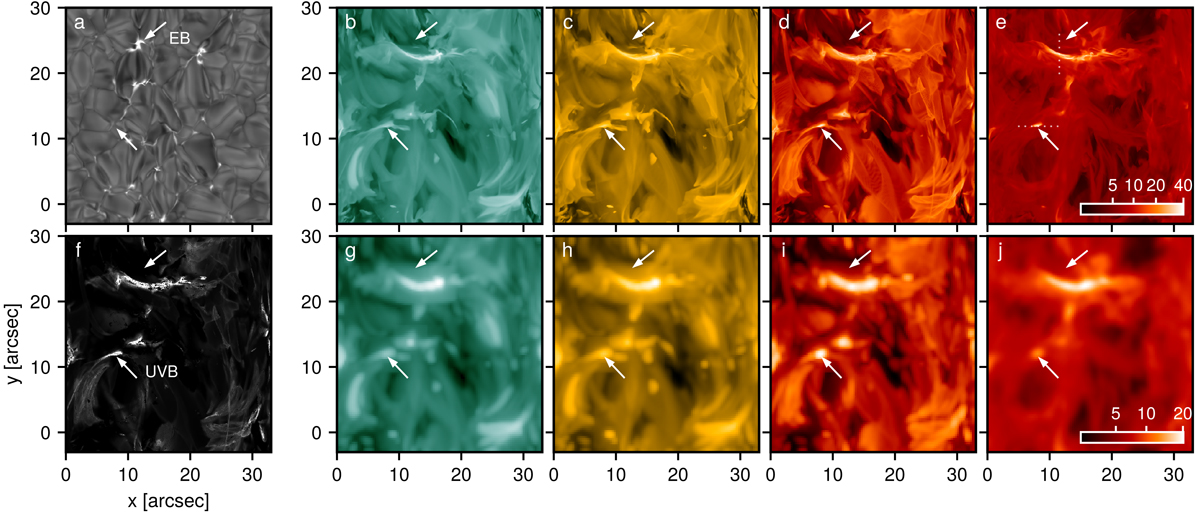
Synthetic emission at different wavelengths from a 3D r-MHD simulation. For context, panels a and f show the Hα line wing (−1.5 Å) and integrated Si IV 1393 Å intensity, respectively. The emission at the simulation’s original scale (0.065″ px−1) in AIA 94, 171, 304 Å, and ALMA 3 mm is shown in panels b–e, respectively, and at the spatial resolution of the observations (0.3″ px−1) in panels g–j, correspondingly. The arrows indicate the locations of one EB and one UVB as labeled in the leftmost panels. Panels b–d and g–i: are displayed in logarithmic scale; panels e, f, j: are shown in power-law scale. The dotted lines in the upper-right panel indicate the locations of the slices shown in Fig. 11.
Current usage metrics show cumulative count of Article Views (full-text article views including HTML views, PDF and ePub downloads, according to the available data) and Abstracts Views on Vision4Press platform.
Data correspond to usage on the plateform after 2015. The current usage metrics is available 48-96 hours after online publication and is updated daily on week days.
Initial download of the metrics may take a while.