Fig. 1.
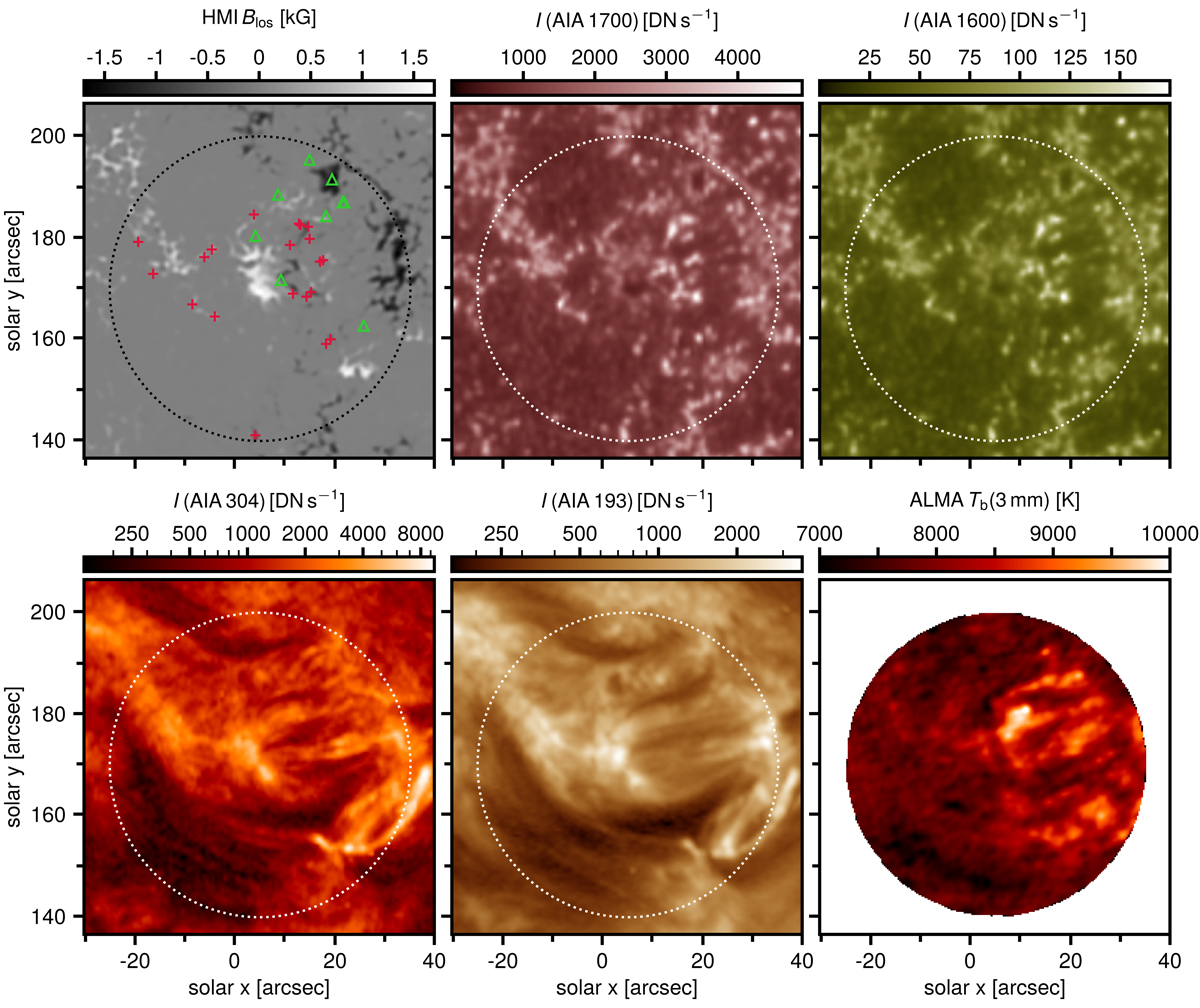
Overview of target as seen by SDO and ALMA on 13 April 2019. Clockwise from top left: HMI magnetogram, spectral radiance in AIA 1600 Å and AIA 1700 Å, ALMA 3 mm brightness temperature (capped at 10 kK for display), and spectral radiance in AIA 193 Å and AIA 304 Å. The dotted circle displays the ALMA field of view. The x and y axes are the helioprojective coordinates at approximately 18:20 UTC. The crosses indicate the location of EBs (see Sect. 3.1), and the triangles correspond to NFs (see Sect. 3.2) that we detected in the entire time series.
Current usage metrics show cumulative count of Article Views (full-text article views including HTML views, PDF and ePub downloads, according to the available data) and Abstracts Views on Vision4Press platform.
Data correspond to usage on the plateform after 2015. The current usage metrics is available 48-96 hours after online publication and is updated daily on week days.
Initial download of the metrics may take a while.