Fig. 9.
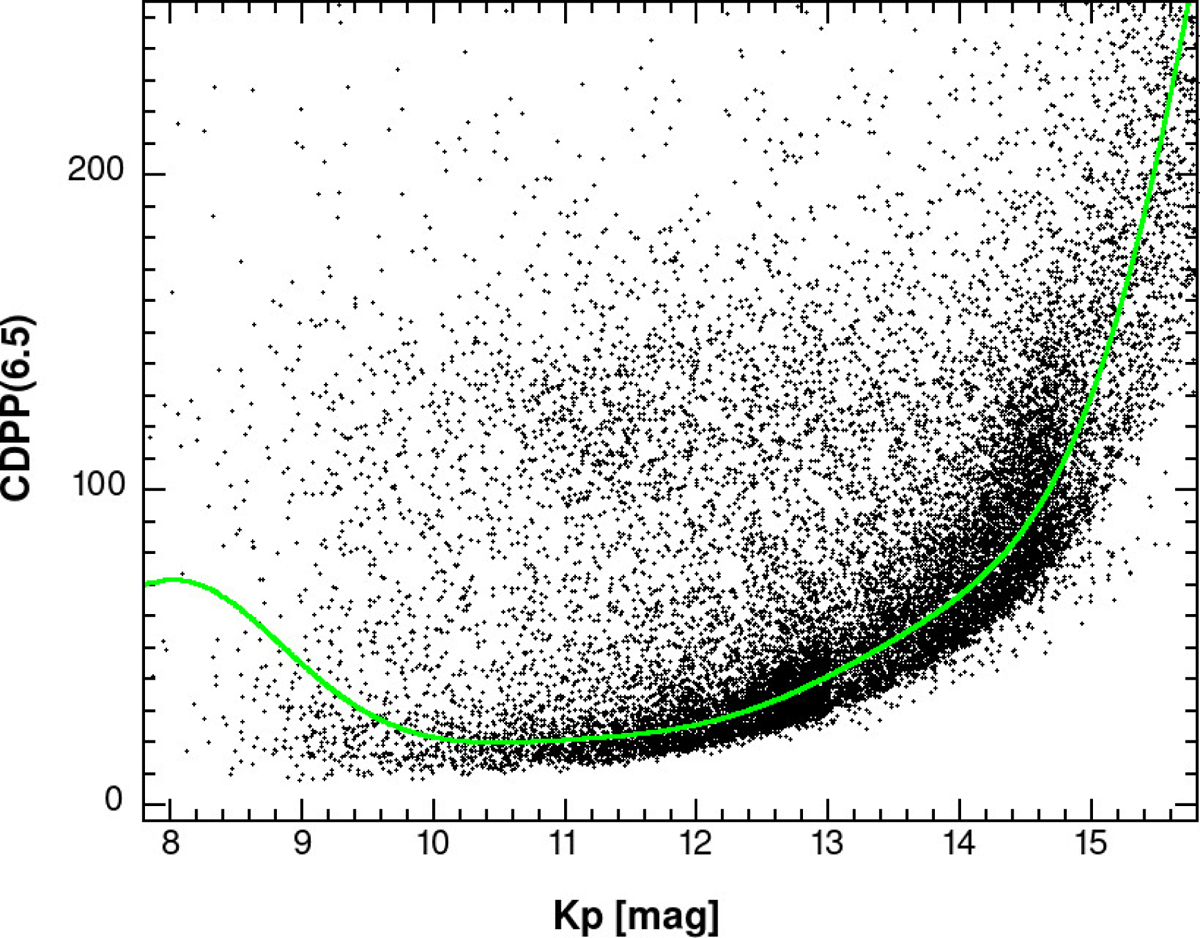
Average of the standard deviations of the 6.5 hour means (in parts per million) vs. stellar brightness. The final time series (i.e., the full, reconstructed models) were used to calculate the standard deviations from the residuals between these and the input (raw) time series. The continuous line shows the robust fit of a 10th order polynomial to the data.
Current usage metrics show cumulative count of Article Views (full-text article views including HTML views, PDF and ePub downloads, according to the available data) and Abstracts Views on Vision4Press platform.
Data correspond to usage on the plateform after 2015. The current usage metrics is available 48-96 hours after online publication and is updated daily on week days.
Initial download of the metrics may take a while.