Fig. 7.
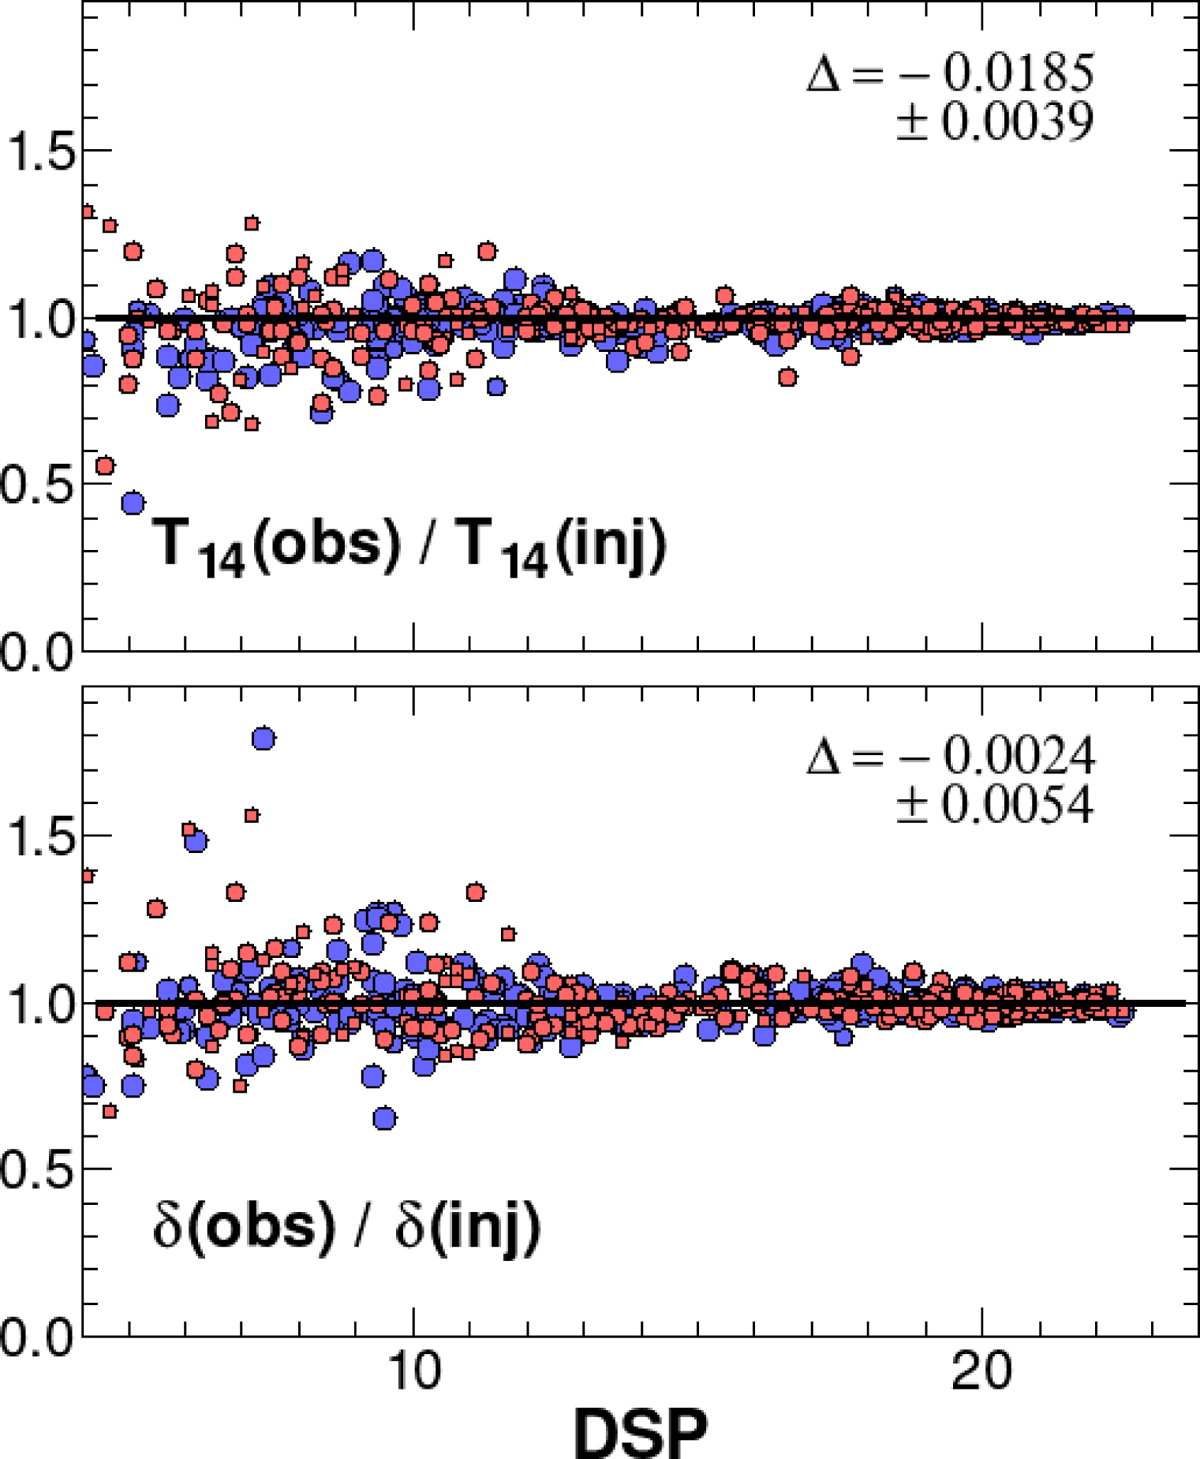
Ratio of the observed and injected transit depths δ and durations, T14, as functions of the dip significance parameter DSP. Transit parameters have been derived by using signal reconstruction. Red and blue points show the result with (signal B) and without (signal A) added sinusoidal component to mimic stellar variability. Inset labels show the mean differences and their errors for signal A. The estimated transit parameters show no overall bias.
Current usage metrics show cumulative count of Article Views (full-text article views including HTML views, PDF and ePub downloads, according to the available data) and Abstracts Views on Vision4Press platform.
Data correspond to usage on the plateform after 2015. The current usage metrics is available 48-96 hours after online publication and is updated daily on week days.
Initial download of the metrics may take a while.