Fig. 5.
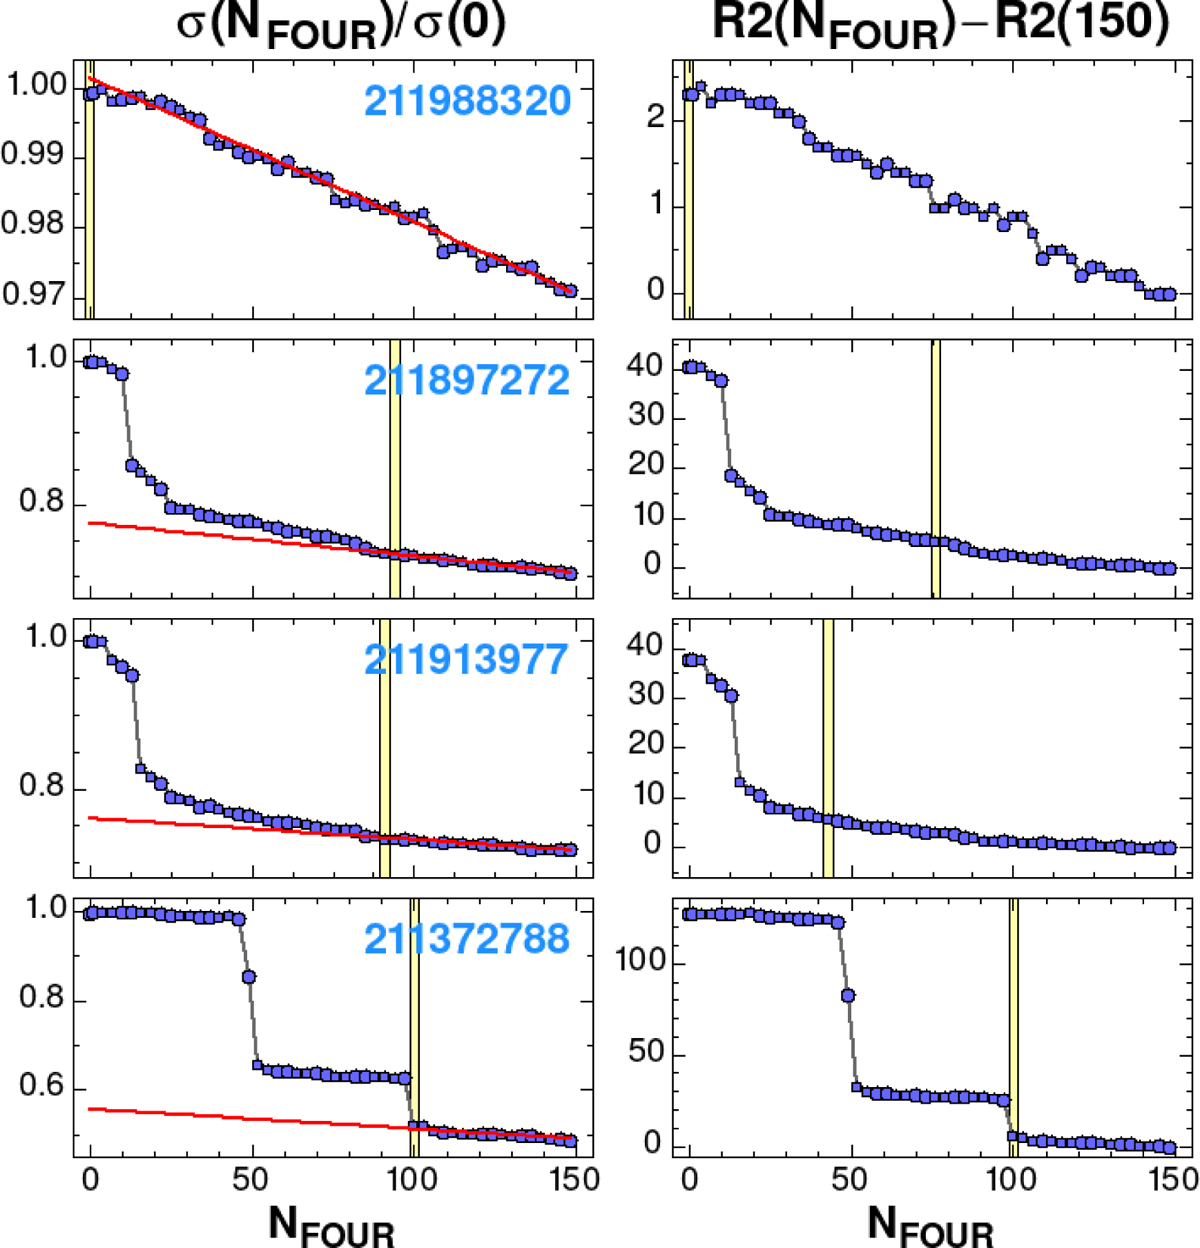
Examples on the optimized selection of the Fourier order. Left column: normalized standard deviation of the Fourier fit as a function of the Fourier order. Red line shows the robust linear regression to the data in NFOUR = 100 − 150. Right column: fit variances over the standard deviation of the fit variance at NFOUR = 150. Vertical yellow stripes show the optimum Fourier orders derived from the statistics given in the header. See text for further details.
Current usage metrics show cumulative count of Article Views (full-text article views including HTML views, PDF and ePub downloads, according to the available data) and Abstracts Views on Vision4Press platform.
Data correspond to usage on the plateform after 2015. The current usage metrics is available 48-96 hours after online publication and is updated daily on week days.
Initial download of the metrics may take a while.