Fig. 4.
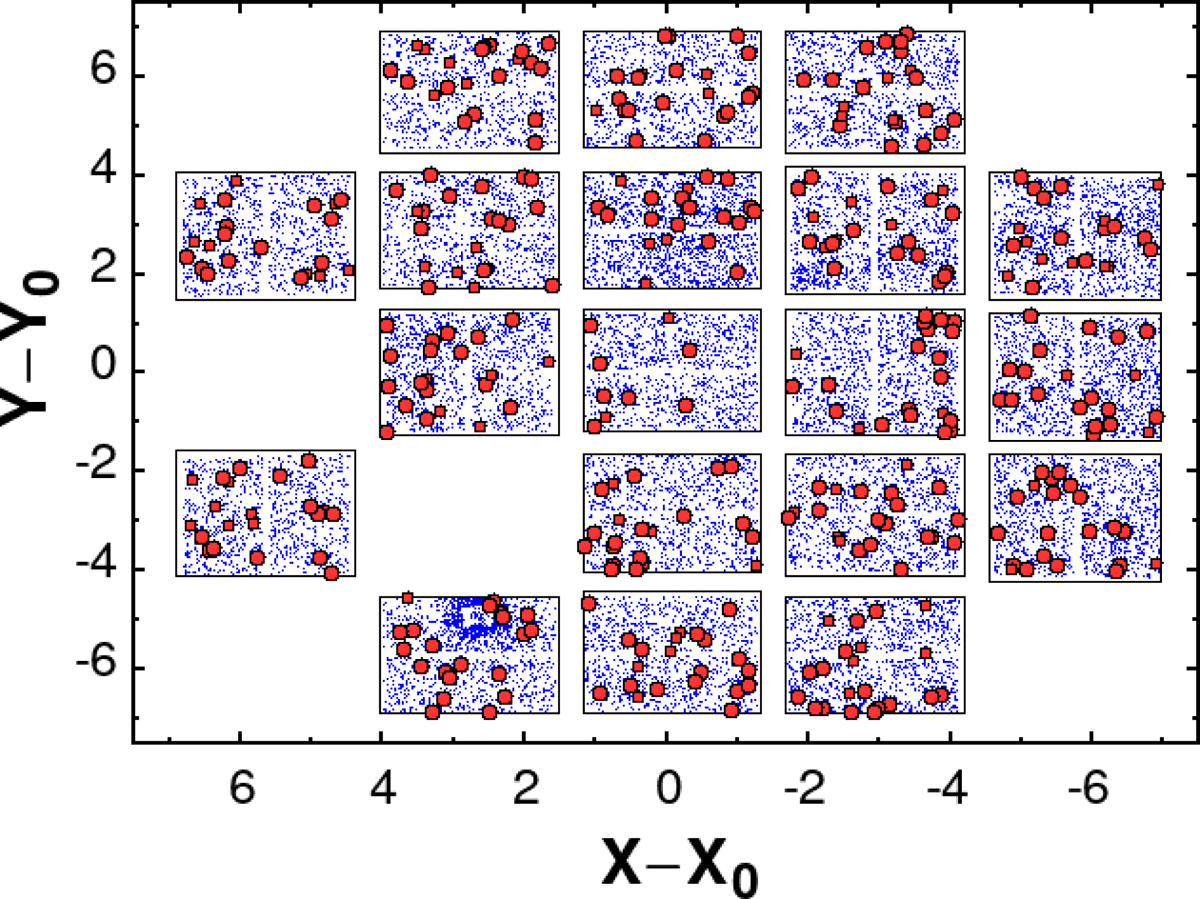
Distribution of the TFA template stars (red dots) for 387 templates. The X and Y coordinates (given in [deg] relative to the center of the field) result from the transformation of the equatorial coordinates to remedy strong distortions of the CCD subfields (see text). The best-fitting rectangles to the hulls of the subfields are shown by black lines. The small blue dots show the stars with Kepler photometry.
Current usage metrics show cumulative count of Article Views (full-text article views including HTML views, PDF and ePub downloads, according to the available data) and Abstracts Views on Vision4Press platform.
Data correspond to usage on the plateform after 2015. The current usage metrics is available 48-96 hours after online publication and is updated daily on week days.
Initial download of the metrics may take a while.