Fig. 3.
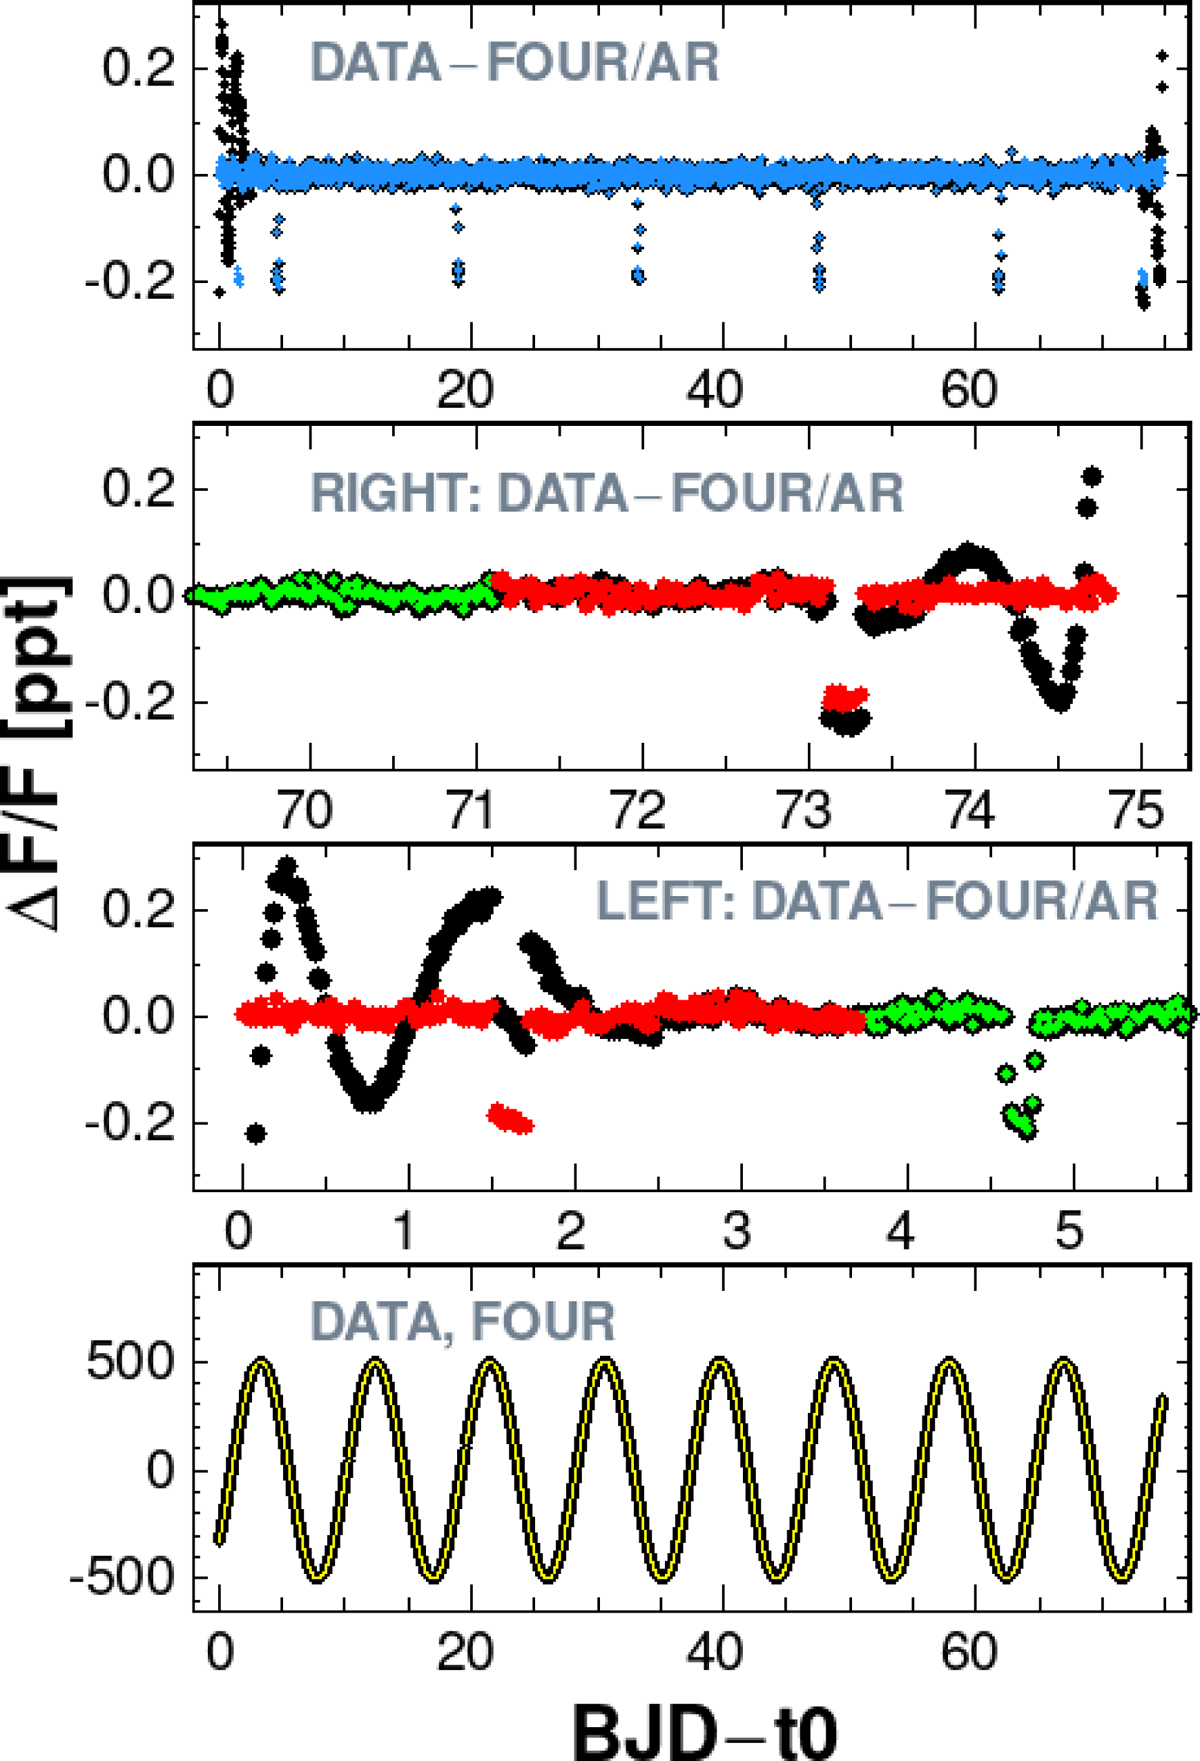
Illustration of the elimination of the Gibbs oscillations at the edges of the dataset by using AR modeling. Bottom: input dataset (black line: noisy sinusoidal with transits), Fourier fit (yellow). Transits are not visible at this scale. Middle panels: residual signal after subtracting the best Fourier fit and the best AR model (black and red dots, respectively). The green dots indicate where the Fourier fit was accepted. Uppermost panel: residual time series obtained by Fourier (black) and AR modeling (light blue). See text for the main signal parameters.
Current usage metrics show cumulative count of Article Views (full-text article views including HTML views, PDF and ePub downloads, according to the available data) and Abstracts Views on Vision4Press platform.
Data correspond to usage on the plateform after 2015. The current usage metrics is available 48-96 hours after online publication and is updated daily on week days.
Initial download of the metrics may take a while.