Fig. 2.
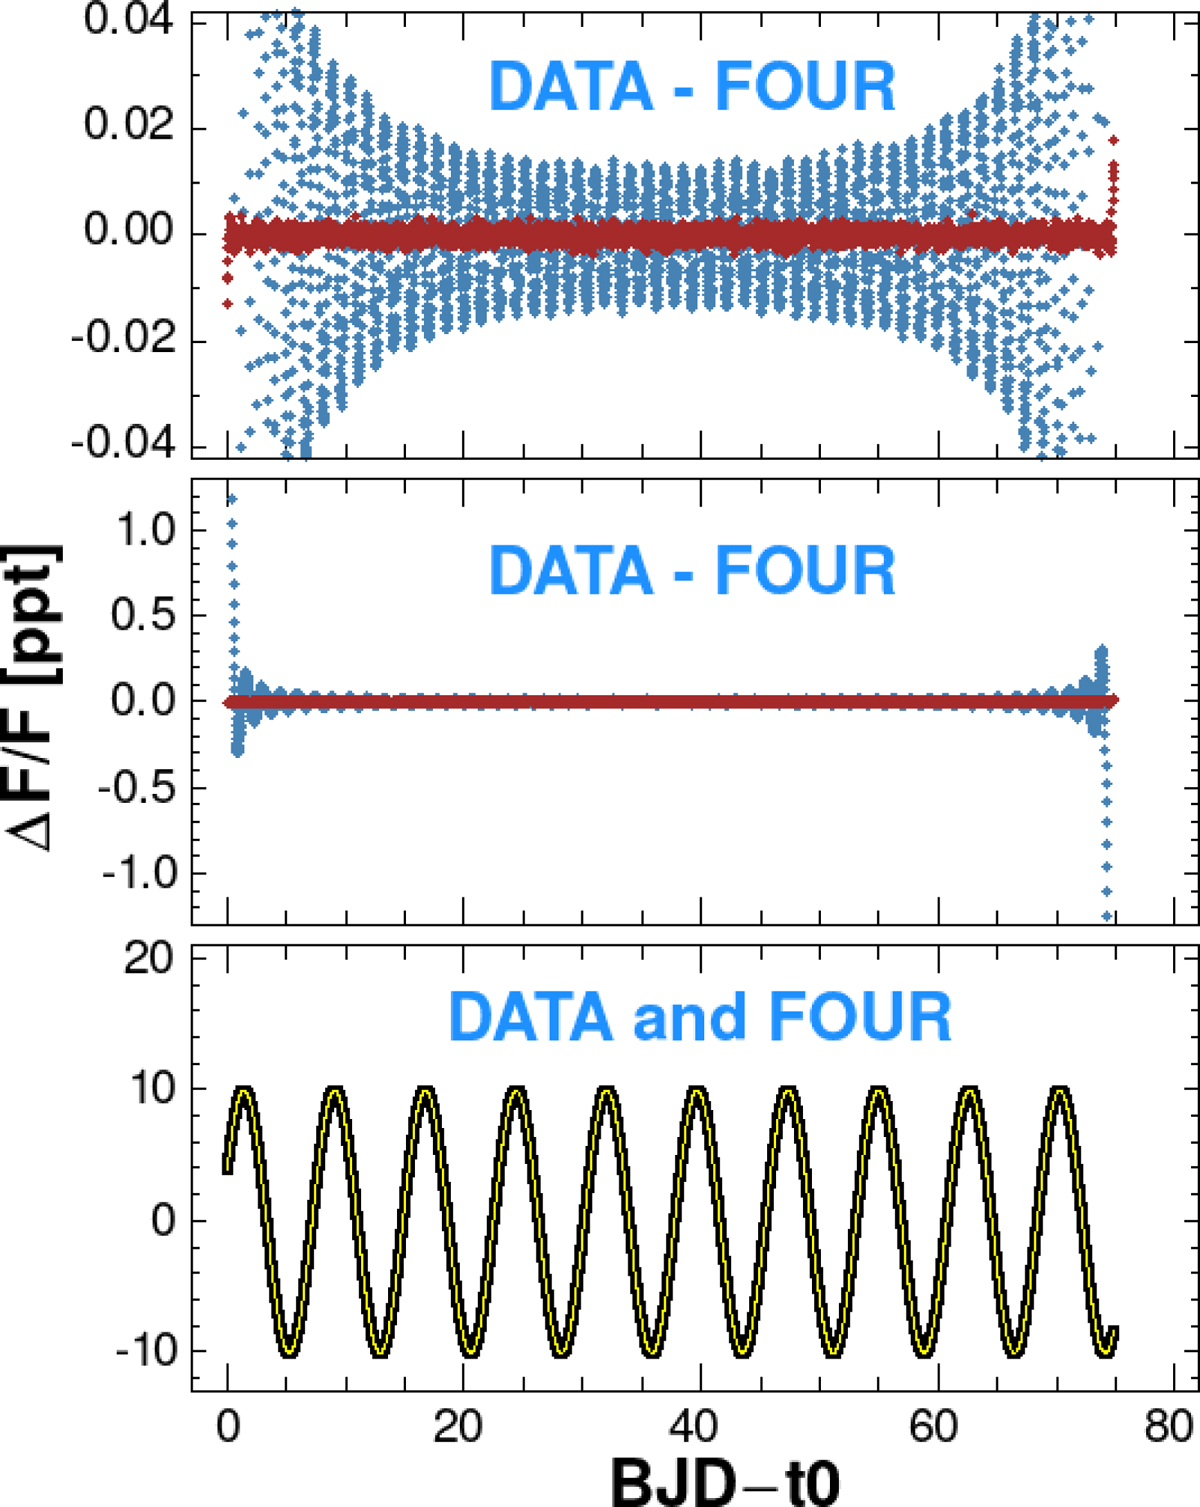
Illustration of the effect of frequency detuning with fixed frequency components {fi = (i + 1)/(β × T)}, where T is the total time span and β = 1.0 for the classical Fourier decomposition (steelblue dots) and β = 1.05 for the detuned case (brown dots). Lower panel: input sinusoidal signal (black line) and the Fourier fit (yellow line – there is no β dependence on this scale).
Current usage metrics show cumulative count of Article Views (full-text article views including HTML views, PDF and ePub downloads, according to the available data) and Abstracts Views on Vision4Press platform.
Data correspond to usage on the plateform after 2015. The current usage metrics is available 48-96 hours after online publication and is updated daily on week days.
Initial download of the metrics may take a while.