Fig. A.1.
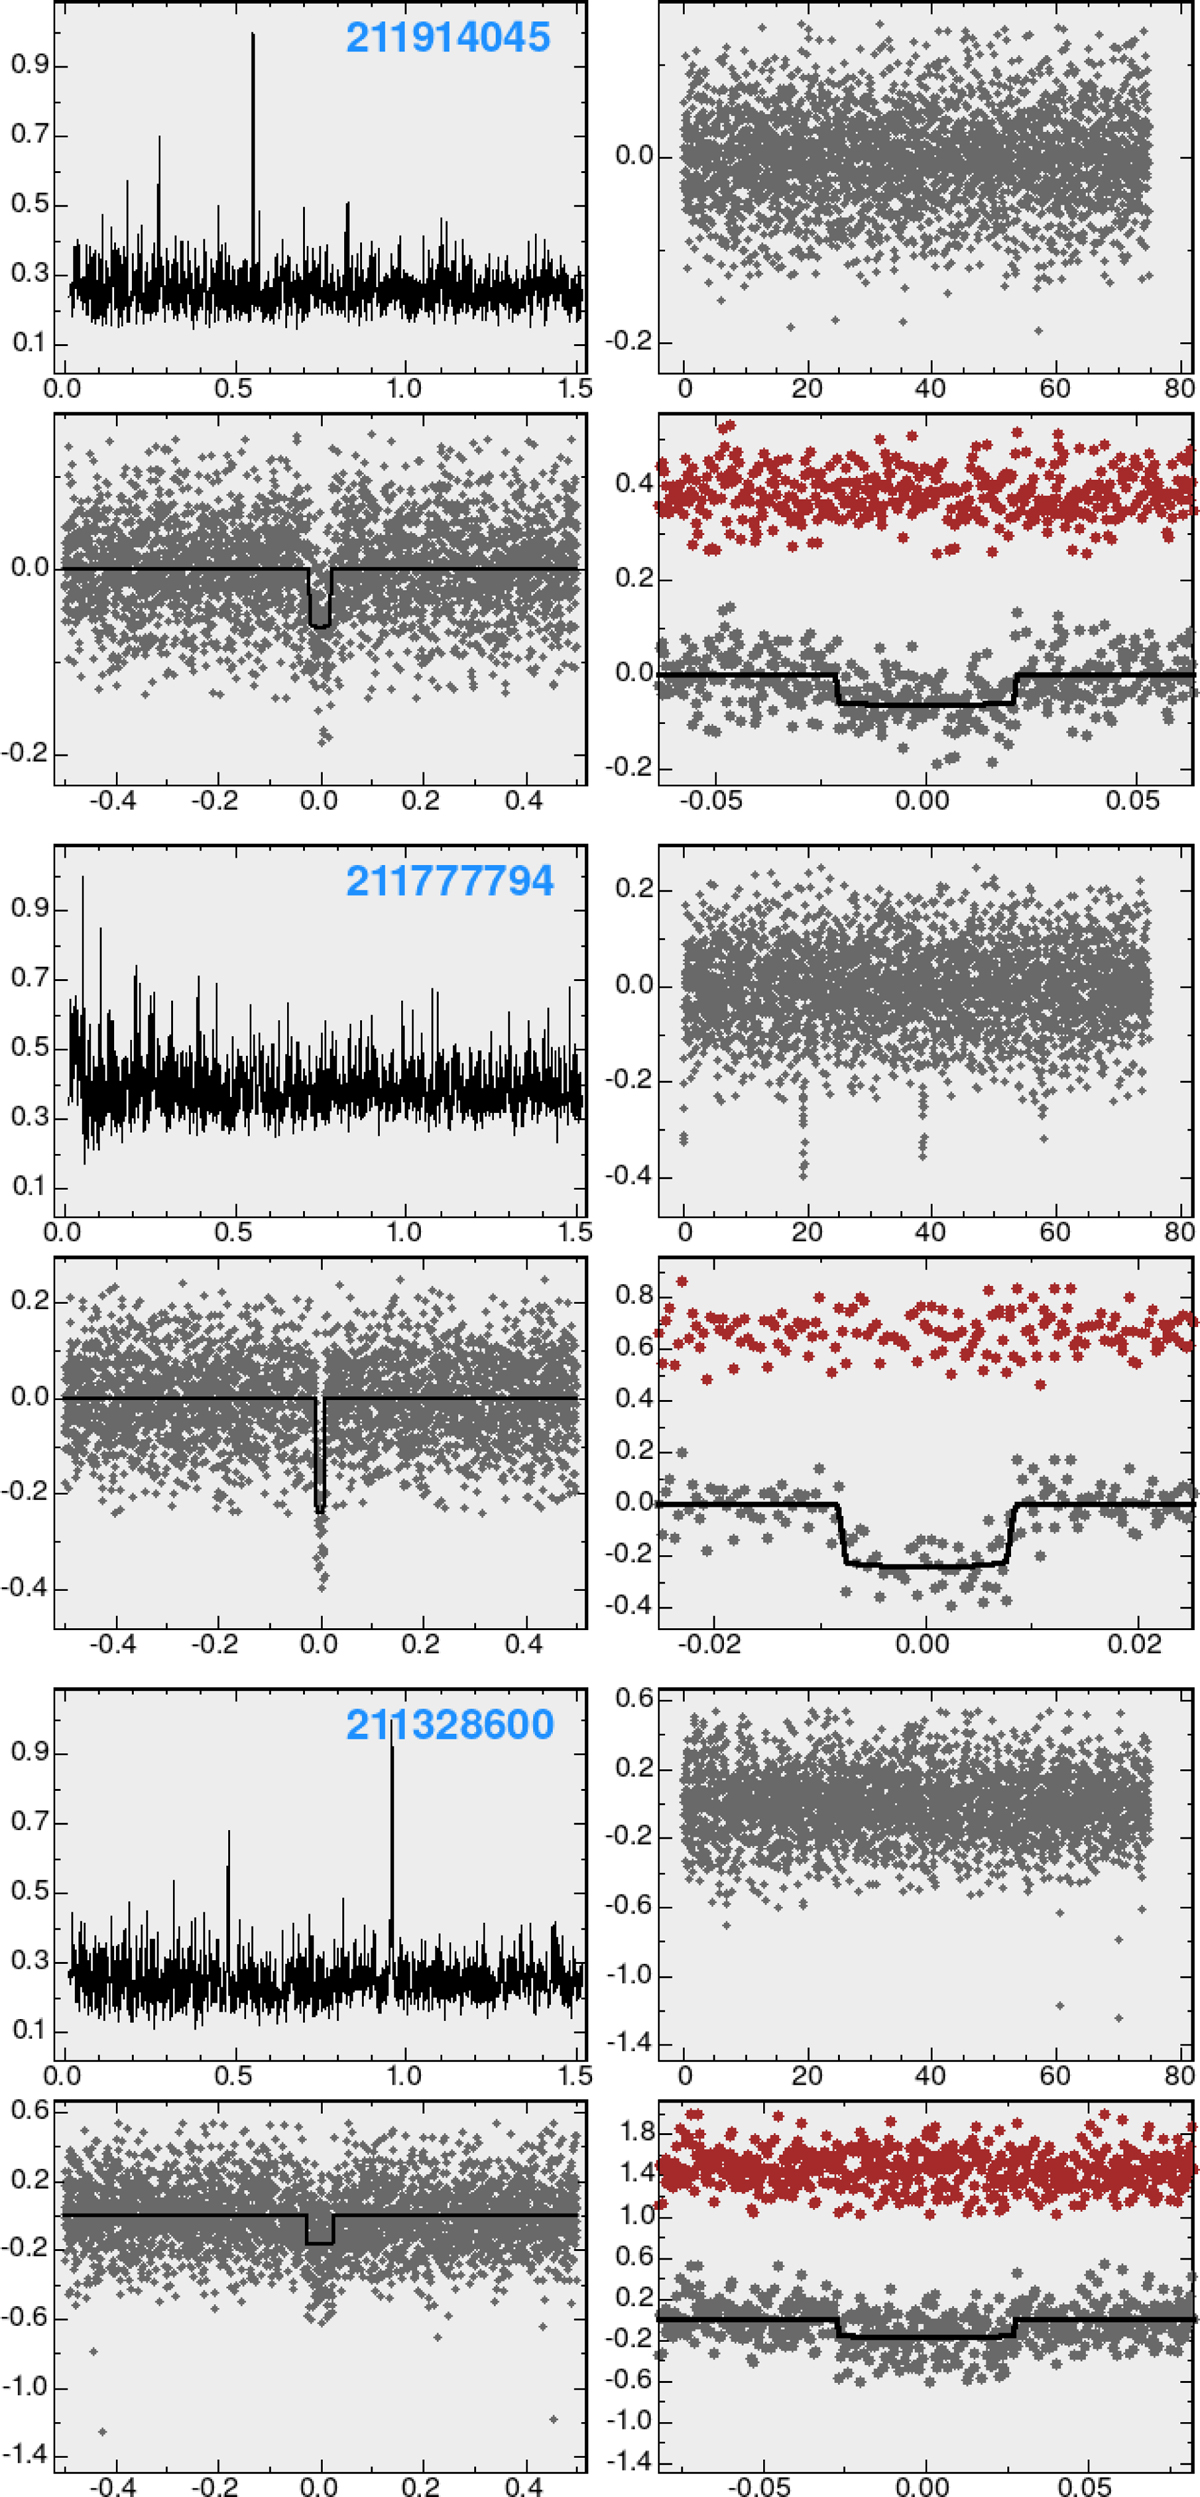
Diagnostic plots for the new candidates. Clock-wise for each star: BLS spectrum, time series, zoomed and full phase-folded light curves. For the zoomed light curve the residuals (data minus model) are shifted upward for better visibility. Transit model: Black line. Y axis units: arbitrary (BLS), ppt (others). X axis units: d−1 (BLS), BJD−2457139.610425 (time series), phase (others).
Current usage metrics show cumulative count of Article Views (full-text article views including HTML views, PDF and ePub downloads, according to the available data) and Abstracts Views on Vision4Press platform.
Data correspond to usage on the plateform after 2015. The current usage metrics is available 48-96 hours after online publication and is updated daily on week days.
Initial download of the metrics may take a while.