Fig. 11.
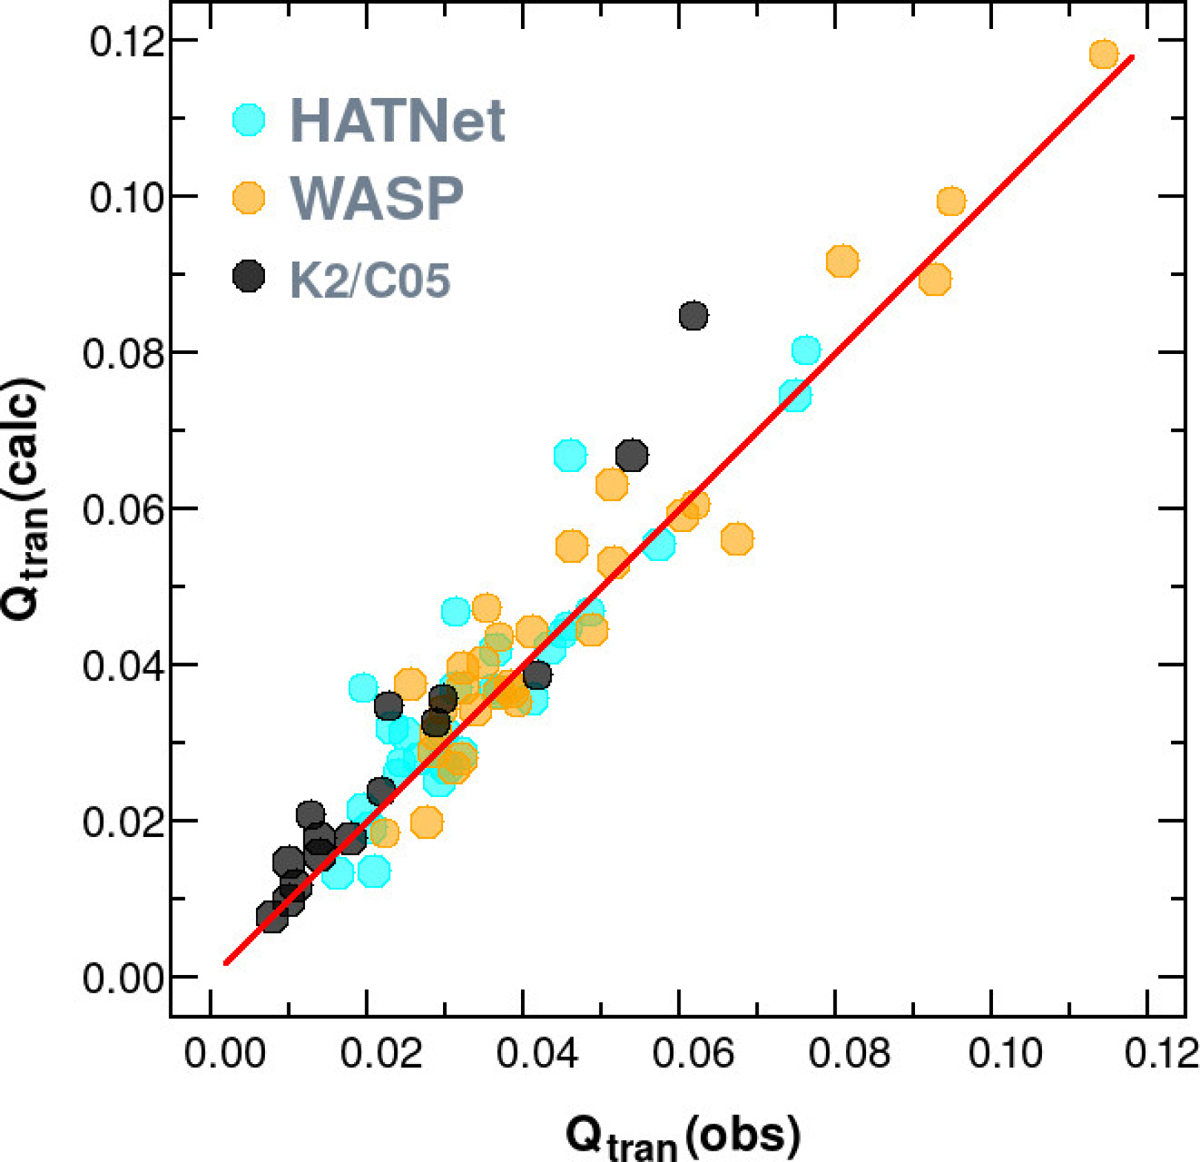
Observed vs. calculated relative transit durations for the 15 systems presented in this paper, together with the 30 HATNet and 30 WASP planetary systems detailed in Appendix B. Equation (16) was used to derive Qtran(calc). The surplus of objects above the 45° line indicates the expected effect of off-central transit. The slight excess of systems below the 45° line is due to errors in the stellar masses and radii.
Current usage metrics show cumulative count of Article Views (full-text article views including HTML views, PDF and ePub downloads, according to the available data) and Abstracts Views on Vision4Press platform.
Data correspond to usage on the plateform after 2015. The current usage metrics is available 48-96 hours after online publication and is updated daily on week days.
Initial download of the metrics may take a while.