Free Access
Fig. 10.
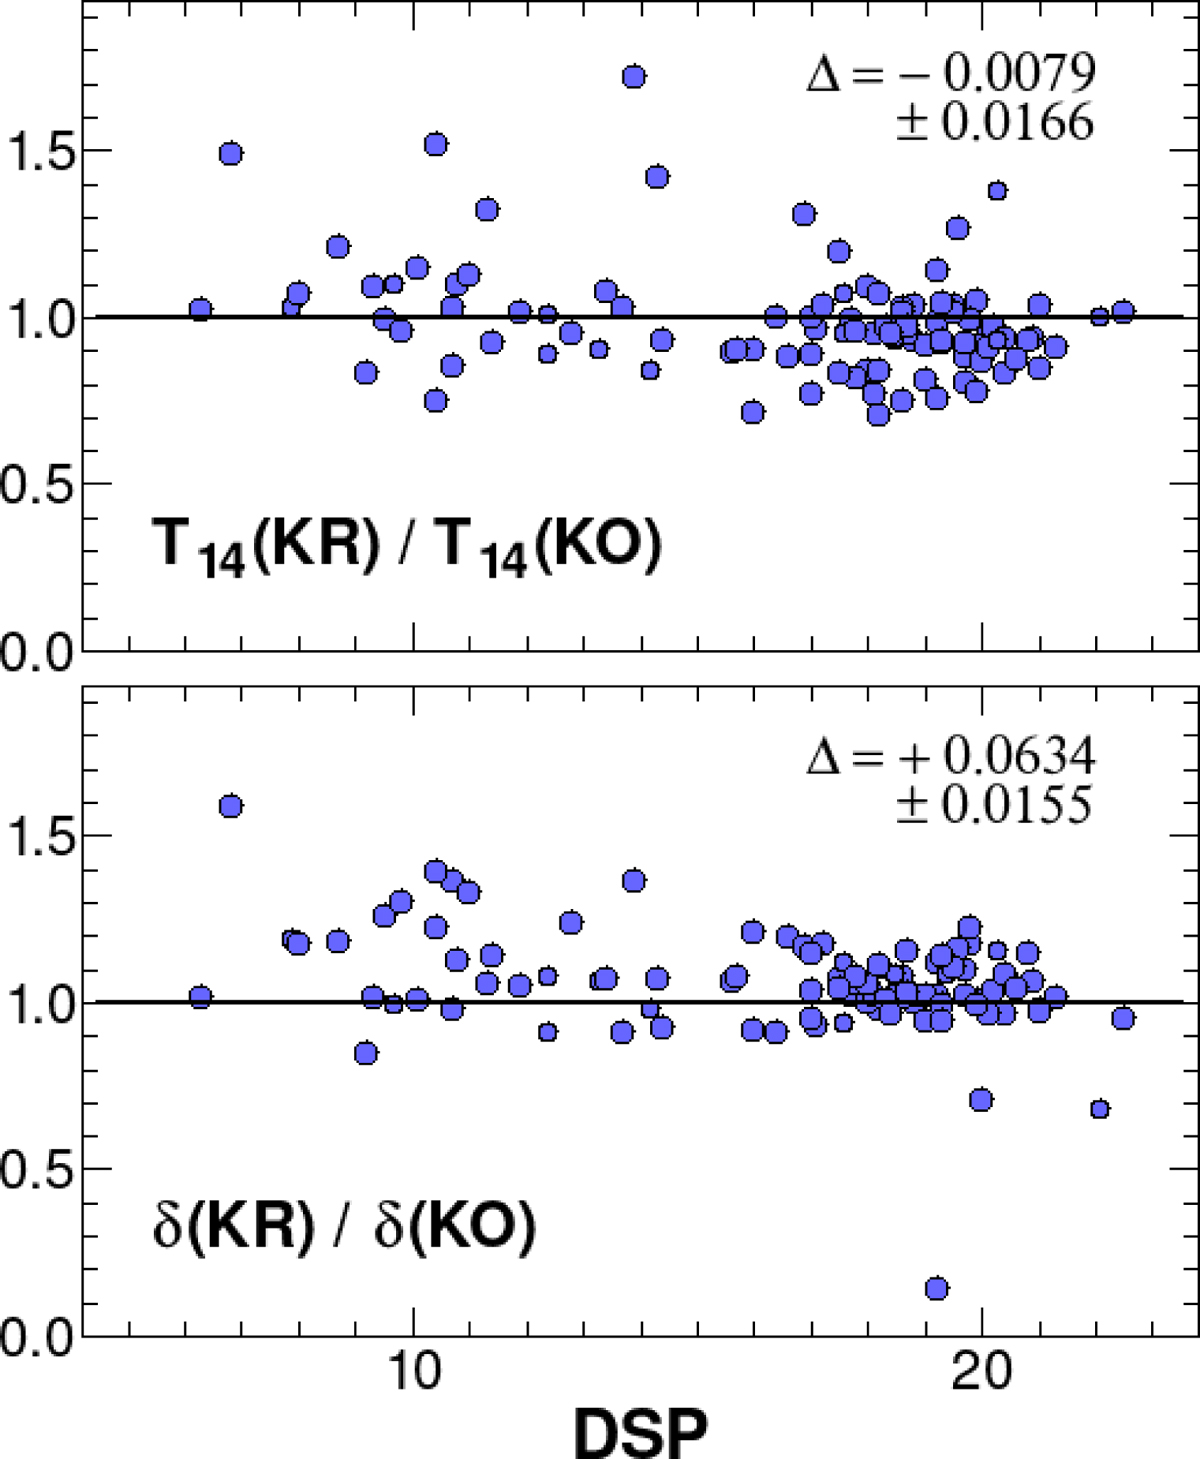
Comparison of the transit depth δ and transit duration T14 between this work (KO) and that of Kruse et al. (2019) (KR). The 103 targets detected from the analysis of the PET dataset are plotted. The mean differences and their errors are shown in the upper right corners.
Current usage metrics show cumulative count of Article Views (full-text article views including HTML views, PDF and ePub downloads, according to the available data) and Abstracts Views on Vision4Press platform.
Data correspond to usage on the plateform after 2015. The current usage metrics is available 48-96 hours after online publication and is updated daily on week days.
Initial download of the metrics may take a while.