| Issue |
A&A
Volume 643, November 2020
|
|
|---|---|---|
| Article Number | A10 | |
| Number of page(s) | 8 | |
| Section | Cosmology (including clusters of galaxies) | |
| DOI | https://doi.org/10.1051/0004-6361/202038670 | |
| Published online | 27 October 2020 | |
SDSS J1004+4112: the case for a galaxy cluster dominated by primordial black holes
Institute for Astronomy (IfA), University of Edinburgh, Royal Observatory, Blackford Hill, Edinburgh EH9 3HJ, UK
e-mail: This email address is being protected from spambots. You need JavaScript enabled to view it.
Received:
16
June
2020
Accepted:
8
September
2020
Abstract
Aims. This paper is aimed at providing a plausible explanation for the large amplitude microlensing events observed in the cluster-lensed quasar system, SDSS J1004+4112. The microlensed quasar images appear to lie well clear of the stellar population of the cluster, raising the possibility that the cluster dark matter is composed of compact bodies that are responsible for the observed microlensing.
Methods. We established the exact structure of the difference light curves attributed to microlensing from photometric monitoring programmes in the literature. We showed, based on measurements of surface brightness, that the probability of microlensing by stars in the cluster is negligible. We relaxed our initial assumption that the cluster dark matter takes the form of smoothly distributed particles and we hypothesized that it is made up of compact bodies. We then used computer simulations of the resulting magnification pattern to estimate the probability of microlensing.
Results. Our results show that for a range of values for source size and lens mass, the large microlensing amplitude that is observed is consistent with the statistics obtained from the simulations.
Conclusions. We conclude that providing the assumption of smoothly distributed dark matter is relaxed, the observed large amplitude microlensing can be accounted for by assuming that the cluster’s dark matter is in the form of compact bodies of solar mass. We further conclude that the most plausible identification of these bodies is that of primordial black holes.
Key words: dark matter / gravitational lensing: micro / galaxies: halos / galaxies: clusters: intracluster medium
© ESO 2020
1. Introduction
SDSS J1004+4112 is a rare example of a quasar that is lensed by a galaxy cluster (Inada et al. 2003). The quasar at a redshift of zs = 1.734 is split into five images by a small galaxy cluster at zd = 0.68. The overall configuration of the quasar images and galaxies in the lensing cluster is shown in the Hubble Space Telescope (HST) composite image in Fig. 1. In this paper, we follow the notation of Inada et al. (2003) for the identification of the quasar images A − D. The system has been extensively monitored photometrically (Fohlmeister et al. 2007, 2008; Fian et al. 2016), with a view to establishing time delays between the quasar images. This has been successful for delays between images A, B, and C, but the long interval for image D has yet to be measured. These monitoring programmes were primarily motivated by the need to improve the constraints on the mass modelling of the system, but in addition, an important result was the detection of microlensing of the A − B image pair (Fohlmeister et al. 2007), which was subsequently confirmed for all images (Fian et al. 2016). In addition to the differential variation of the brightness of the images, microlensing has also been detected by comparing brightness variations in different photometric passbands (Ross et al. 2009) or between spectral lines and the continuum (Motta et al. 2012). These measures also provide a zero-point for the photometric difference light curves. The other main focus of works on SDSS J1004+4112 has been the measurement of the size of the quasar accretion disc (Fohlmeister et al. 2008; Fian et al. 2016). This is an important parameter for estimating the expected microlensing amplitude and we discuss it in more detail in Sect. 4.
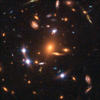 |
Fig. 1. Hubble Space Telescope colour image of the lensed quasar SDSS J1004+4112, showing the lensing cluster. The frame is approximately 30 arcsec on a side and north is up, east is to the left. |
The main purpose behind this paper is to investigate the source of the observed microlensing. A cursory examination of the lensing cluster illustrated in Fig. 1, and in particular, the dominant central galaxy, suggests that the stellar population has effectively become negligible well before the radial distance of the quasar images close to the Einstein ring is reached. In this paper, we use measures from deep HST frames in the infrared to estimate the probability of microlensing by stars in the central cluster galaxy, based on the assumption that the dark matter in the galaxy halo, as measured from modelling the lens system, is smoothly distributed. The chance superposition of dwarf galaxies on the quasar images is another possibility that may account for the microlensing. To quantify this effect, we measured the optical depth to microlensing over a large area of the cluster where there is a population of dwarf galaxies, in both the infrared and visual wavebands. From this analysis, again assuming that the dark matter is smoothly distributed, we conclude that it is very unlikely that the observed microlensing is caused by stars.
If the assumption that the dark matter is smoothly distributed is abandoned and, instead, we assume that it takes the form of compact bodies, the probability that the quasar images are microlensed is greatly increased. We quantify this unsurprising result with computer simulations of typical magnification patterns for a population of solar mass bodies with convergence and shear equal to those found from lensing models in the vicinity of the quasar images. The main conclusion of this paper is that the probability that the observed microlensing in the cluster lens SDSS J1004+4112 can be attributed to stars is very small. If the assumption of smoothly distributed dark matter is relaxed and we assume the cluster halo is composed of stellar mass compact bodies, then the observed microlensing is consistent with the statistics of the simulations. We further conclude that the most plausible candidates for the compact bodies are primordial black holes of around one solar mass. Throughout the paper, we assume ΩM = 0.27, ΩΛ = 0.73, and H0 = 71 km s−1 Mpc−1 for cosmological calculations.
2. Light curves
The main motivation behind this paper is to understand how quasar images in an apparently sparse stellar environment can show strong variations in brightness due to the effects of microlensing. In this section, we make use of extensive observations from the literature to establish the amplitude of the microlensing variations. After the discovery of SDSS J1004+4112 (Inada et al. 2003), the first light curves to be published (Fohlmeister et al. 2007) showed variations in images A, B, C, and D over a three-year period. The time delay between image A and B was measured to be 38 days, and when this delay was applied to the light curves, the flux ratio between the two images was seen to vary with time, which was interpreted as a detection of microlensing. The light curves were extended for a further year by Fohlmeister et al. (2008), who determined the time interval for image C which they showed leads image A by 821.6 ± 2.1 days, and refined the time delay between images A and B to 40.6 ± 1.8 days. An additional four years of photometric monitoring were added by Fian et al. (2016), who found a strong microlensing signal for image C.
An alternative approach to measuring microlensing is based on the idea that light in the infrared or from the broad or narrow line region of the quasar comes from an area that is too large to be significantly microlensed. In this case, photometry of the quasar images will yield the true flux ratios resulting from the mass distribution and alignment of the lensing galaxy or cluster. By contrast, the structure of the accretion disc in the UV rest frame are sufficiently compact that microlensing by compact stellar mass bodies is a possibility. By comparing the flux ratios of the images in these two regimes, the effects of microlensing can be detected in a single epoch. This approach can also be used to determine the zero-point for light curves obtained from photometric monitoring programmes. After allowing for time lags in light arrival time, the magnitude difference between two quasar images removes the effects of intrinsic variability. The resulting light curve of magnitude difference as a function of time provides a useful measure of microlensing, but it only shows relative changes in magnitude difference. The measures of intrinsic flux differences described above can provide a zero-point for these difference light curves to give the true magnitude difference due to microlensing as a function of time.
The comparison of line strength with continuum flux was used to look for microlensing in SDSS J1004+4112 by Mediavilla et al. (2009). Based on observations made in 2004, they detected no microlensing in the A − B image pair, but they did detect a strong microlensing amplification of 0.45 mag for A − C. They also used these data to calculate the zero-points for the B − A and C − A difference light curves, finding (MB − MA)0 = 0.50 and (MC − MA)0 = 0.19. The value for B − A was later refined by Motta et al. (2012) to (MB − MA)0 = 0.52 ± 0.07. Based on their observations in 2008, Motta et al. (2012) also detected a microlensing signal for the A − B image pair of 0.2 mag. In addition, Mediavilla et al. (2009) compared their spectroscopic results with flux ratios in the mid-infrared from Ross et al. (2009) and concluded that differences between extinction in the mid-infrared and optical where the light curves are measured make spectroscopic measures of flux ratios the preferred choice. On this basis we follow Mediavilla et al. (2009) and Motta et al. (2012) and we use their spectroscopic zero-points in this paper.
To measure the amplitude and illustrate the morphology of microlensing variations, we made use of the photometry of Fohlmeister et al. (2007, 2008) and Fian et al. (2016). Firstly, the epoch of each observation was corrected for time lag due to the difference in time travel for light from the three images using the results of Fohlmeister et al. (2008). They find that image B leads image A by 40.6 ± 1.8 days and image C leads image A by 821.6 ± 2.1 days. Using these data, we converted all photometric observations to the epoch of image A. In order to emphasize the long-term trends in the data, we binned them in half-yearly intervals and calculated the weighted mean for each image. In order to remove the effects of any intrinsic variation of the quasar, we then subtracted the binned data for each epoch to produce difference light curves for each pair of quasar images. Figure 2 shows the difference light curves for the B − A, C − A, and B − C image pairs. Zero-points, as described above, from Mediavilla et al. (2009) and Motta et al. (2012) were applied to the light curves to give true measures of the difference in microlensing between the two images.
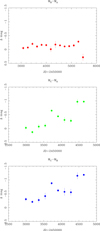 |
Fig. 2. Difference light curves for images A, B, and C of the gravitationally lensed quasar SDSS J1004+4112. The differential variations of the images are attributed to microlensing. The derivation of the zero-point is described in the text. |
The variations in the difference light curves in Fig. 2 show that all image pairs are being microlensed, with amplitudes of 0.56, 1.10, and 0.98 mag for B − A, C − A, and C − B respectively. This, in turn, implies that at least two of the three images, and very probably all three, are individually microlensed.
3. The lensing cluster
In this section, we measure the optical depth to microlensing τ as a function of radius for the stellar population of the central dominant galaxy in the lensing cluster, based on the assumption that the dark matter is smoothly distributed. Here, τ is defined (Schneider et al. 1992) as
 (1)
(1)
where κ* and κc are the surface mass densities in compact bodies and smoothly distributed matter, respectively, in units of the critical surface mass density Σcr, and
 (2)
(2)
Here, Dg, Dq, and Dgq are the angular diameter distances to the lensing galaxy, to the quasar, and from the galaxy to the quasar respectively. To calculate τ, we need values for κ* and κc.
The procedure we follow is to start by measuring the surface brightness as a function of radius from Hubble Space Telescope (HST) frames in the F160W passband (close to the H-band). The choice of this band is to maximize the contrast between the blue light of the quasar images and the largely red light of the galaxy stellar population. The surface brightness profile is then combined with the stellar mass-to-light ratio to give the surface mass density profile. When this is converted to units of critical density, it traces κ*, the convergence due to the stellar population, as a function of distance from the galaxy centre. To evaluate τ, we also need values for κc, the smoothly distributed dark matter, which we obtain from mass models of the gravitational lens system.
The measurement of the surface brightness is more straightforward for SDSS J1004+4112 than for most quasar systems, where the images are embedded in the lensing galaxy and point spread function subtraction techniques are necessary for measuring the uncontaminated galaxy profile (Bernstein et al. 1997; Hawkins 2020). The wide separation of the images resulting from the large mass of the lensing cluster puts them well clear of the central dominant galaxy and enables a straightforward measurement of surface brightness. The first step was to measure a deep HST frame in the F160W passband using standard photometric techniques to give a galaxy profile of counts per square arcsecond as a function of distance from the galaxy centre. These measures were then converted to surface brightness using the relevant HST photometric zero-point.
The next step was to convert the surface brightness profile to units of stellar luminosity per square arcsecond and apply K and evolutionary corrections from Poggianti (1997) to give a zero-redshift galaxy profile in units of stellar luminosity in the H-band. To convert stellar luminosity to mass density, we use the value for mass-to-light ratio derived by Hawkins (2020). As direct measures of stellar mass-to-light ratios for galaxies are not normally feasible due to the pervasive contribution of dark matter, this is based on dynamical measures for globular clusters in the Galaxy and M 31, where it is generally assumed that the dark matter content is negligible. The cluster masses are derived from stellar velocity dispersions, and provide a direct measure of stellar mass which can then be combined with photometry of the clusters to give the stellar mass-to-light ratio. An alternative approach is to use population synthesis models to estimate the stellar mass-to-light ratio in elliptical galaxies, which gives results consistent with the dynamical measures. There are a number of complicating issues involved in these measurements that are discussed in detail by Hawkins (2020), giving a final value of M/LH = 0.56 ± 0.21, which we adopt in this paper. The resulting surface mass density, when converted to units of critical density using Eq. (2), gives κ* as a function of distance from the central cluster galaxy.
To evaluate κc, the convergence from smoothly distributed matter, we use values of total convergence κ from lens modelling of the quasar system. Although there has been some difficulty in accurately reproducing the positions of the quasar images and time delays (Fohlmeister et al. 2008), the values of convergence and shear from different models are stable (Fohlmeister et al. 2008; Fian et al. 2016). For this paper, we use values of κ and γ from Fian et al. (2016) for their singular isothermal sphere plus external shear (SIS + γe) model. κc is now just the difference between κ and κ*.
Figure 3 shows κ*, the convergence resulting from the stellar population of the dominant cluster galaxy, as a function of distance from the galaxy centre. Where the curve flattens out, a small demagnification of κ* ∼ −0.015 is apparent, which we removed with a median filter to give a clearer idea of the fluctuation of the convergence around zero. The positions of images A, B, and C are marked at their distances from the centre of the galaxy. Also shown is the total convergence from the mass model of the quasar system from Fian et al. (2016). It can be seen that κ* becomes negligibly small at around 25 kpc from the cluster centre and continues to fluctuate about zero with an rms variation of 3.3 × 10⁻⁴ out to 70 kpc, beyond the furthest quasar image.
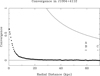 |
Fig. 3. Convergence as a function of radial distance for the lensing cluster J1004+4112. The solid line shows the total convergence, κ, from the lensing model and the filled circles show convergence, κ*, for the stellar population of the lensing cluster. The arrows indicate the positions of the quasar images. |
In order to convert κ* to optical depth to microlensing τ, we make use of Eq. (1). This equation is valid in the low optical depth regime for τ ≲ 0.1 (Kofman et al. 1997), which is certainly fulfilled for images A, B, and C. From the lens model of Fian et al. (2016), the total convergence κ at the three image positions is 0.48, 0.47, and 0.38 respectively – all close to a half as might be expected. Given the very small values for κ* this implies κc ≈ κ, and so, from Eq. (1), we have τ ≈ 2κ*, which is still a very small value.
Given the large values of κ* at the quasar image positions needed to produce the observed microlensing, it was suggested by Fohlmeister et al. (2008) that microlensing might be due to a satellite galaxy rather than intracluster stars. This interesting possibility can be investigated by estimating the integrated optical depth to microlensing over the area of sky occupied by the quasar images, including the contribution from stars in dwarf galaxies. Figure 4 shows deep images from the Hubble Space Telescope in the F160W (H) and F555W (V) bands. A small population of dwarf galaxies is visible, mostly red and more easily visible in the F160W frame, although a small proportion of faint blue galaxies can also be seen. There is no obvious sign of any small galaxy intercepting the line of sight to one of the quasar images, but it is possible that the scattered light surrounding each image, together with the lensed host galaxy of the quasar, is masking the presence of a dwarf galaxy. On each of the frames, we marked two large circles centred on the central cluster galaxy. The inner circle is at 25 kpc, where light from the central galaxy is lost in the noise, as illustrated in Fig. 3. The outer circle is at a radius of 53 kpc, and has been chosen to exclude images A, B, and C. We use the area between the two circles as a basis for the calculation of the optical depth to microlensing for the dwarf galaxy population of the cluster. The area includes parts of small galaxies which are large enough to be clearly visible had they overlapped with a quasar image, along with image D (which we excluded, marked by a small circle). The convergence, κ*, over this area was measured from the F160W frame (as for the profile of the central cluster galaxy) and integrated to give the optical depth to microlensing. The average value of τ = 0.0095 ± 0.0014 should be seen as an upper limit to the probability of microlensing by dwarf galaxies as it includes contributions from larger galaxies and applies to an area closer to the cluster centre than the positions of the quasar images, where we would expect the density of cluster galaxies to be higher. Also, as we point out in Sect. 2, at least two of the quasar images are microlensed, which reduces the probability that dwarf galaxies are the cause of this to less than 10−4.
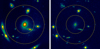 |
Fig. 4. Deep HST frames of the area around the lensed quasar images of the cluster J1004+4112. The photometric passbands are F160W (left-hand panel) and F555W (right-hand panel), close to the H and V bands, respectively. The frames are approximately 15 arcsec on a side; north is up, east to the left. The frames illustrate the likelihood of the stellar populations of small cluster galaxies overlapping the quasar images and producing a microlensing signal. The yellow circles define the boundary of the measurement of optical depth to microlensing for the dwarf cluster galaxies. The three bright star-like images outside the outer circle are, from the north, images B, A, and C. |
The very low probabilities for microlensing of the quasar images derived thus far are based on the assumption that the dark matter in the cluster is smoothly distributed, as would be expected if it were in the form of elementary particles. If this assumption is relaxed and, instead, we assume dark matter is in the form of solar-mass compact bodies (Chapline 1975; Hawkins 1993; Jedamzik 1997; Byrnes et al. 2018) the microlensing probabilities are greatly increased. In this situation, κ* ≈ κ, and so, from the lens modelling, we have κ* ∼ 0.5 in the vicinity of the quasar images. This puts the value of τ well outside the low optical depth regime, as defined by Kofman et al. (1997), and into a region where microlensing probabilities can only be estimated from computer simulations of microlensing amplification patterns. A further motivation for estimating microlensing probabilities from computer simulations is that they can include the effects of shear and source size and take into account the observed amplitude of microlensing.
4. Microlensing simulations
In this section we present simulated amplification patterns for values of κ and γ close to the quasar image positions of SDSS J1004+4112 from the mass models of Fian et al. (2016). The idea is to explain the observed large amplitude microlensing and to this end, we relax the commonly held assumption that dark matter takes the form of smoothly distributed elementary particles and, instead, we allow for the possibility that it is actually in the form of solar-mass compact bodies. The simulations were carried out using the ray tracing software of Wambsganss (1999), with values of κ and γ from Fian et al. (2016). The left-hand panel of Fig. 5 shows the simulation for values of κ and γ at the position of image B, where a point source is assumed.
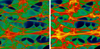 |
Fig. 5. Microlensing magnification patterns for a population of 0.7 M⊙ bodies with parameter values of κ* = 0.39, γ = 0.47 and a point source (left hand panel). Right-hand panel: same simulation but for a source of radius one lt-day. Each frame has a side length of eight Einstein radii in the source plane. The yellow lines indicate tracks across the amplification pattern for the lengths of the B − A and C − A light curves in Fig. 2. A net transverse velocity of 600 km s−1 is assumed (Kayser et al. 1986). |
To quantify microlensing probabilities in this high optical depth regime, we first superimpose a track of the length of the difference light curve, as shown in Fig. 2, on the amplification patterns for each of the two images, in random position and orientation. The magnification change along each track can then be extracted to give simulated light curves in magnitudes and subtracting one curve from the other gives a simulated difference light curve. By repeating this procedure a number of times and counting the frequency with which the amplitude of the simulated light curve exceeds that of the observed one, the likelihood that the observed amplitude is caused by microlensing can be estimated. To illustrate this, in Fig. 4, two such tracks are superimposed in arbitrary positions and orientations of lengths corresponding to the difference light curves for C − B and B − A.
The results from the microlensing simulations are shown in Table 1. The first four columns show the values for κ and γ used in the simulations for each image pair, taken from Fian et al. (2016). The convergence is labelled κ* as we are assuming that the dark matter is composed of compact bodies. Other columns give the assumed lens mass, quasar disc size in units of light days and Einstein radius, the length of the difference light curve in years, and the observed amplitude, Δm in magnitudes, from the difference light curves in Fig. 2. The final columns give the number of trials as described above, the number of times, N(Δ > Δm), that the observed amplitude is exceeded in the simulations, and the resulting probability of microlensing.
Microlensing probabilities for SDSS J1004+4112.
The first two rows in Table 1 illustrate the effect of shear, which has, so far, not been part of our optical depth calculations. Broadly speaking, shear smears the magnification pattern along a preferred axis, making large amplifications less likely to be achieved, but small ones more so. The effect on the microlensing statistics depends on a number of factors, including the amplitude of the observed light curve and the source size, as well as the values of κ* and γ. For the data in Table 1, shear increases the microlensing probability by about 40%.
So far in the simulations, we have assumed a point source but, in practice, the quasar disc radius is a non-negligible fraction of the Einstein radius of the lenses. This means that the source is effectively resolved by the lenses and the magnification reduced. For very large sources, the magnification in magnitudes is reduced asymptotically as δm ∝ θ−1, where θ is the source radius (Refsdal & Stabell 1991). For smaller sources we must use microlensing simulations and the third row of Table 1 shows the results for a quasar disc radius of 1 lt-day. A lens mass of 0.7 M⊙ is assumed, giving a disc radius of 0.07 in units of lens Einstein radius. It can be seen that this substantially reduces the probability of reproducing the observed amplitude of the C − B difference curve. We note that for a source size of four lt-day, the probability becomes negligible.
In microlensing statistics, the mass of the lenses plays a significant part. Although the magnification patterns themselves do not depend on mass, they are scaled to the size of the Einstein radius and, thus, the area of sky they cover increases with mass. This has two consequences: (1) the length of the light curves tracked across the magnification patterns will be longer for smaller masses, making the detection of a microlensing event more likely; (2) the size of the accretion disc relative to the Einstein radius will be larger for smaller masses. As discussed above, this has the effect of reducing the amplification and, hence, making microlensing events of a given magnitude less likely. These two effects work in opposite directions, but we have found that, for the most part, the effect of a longer light curve relative to the amplification pattern dominates and the frequency of microlensing events increases with decreasing lens mass. In the fourth row of Table 1, the lens mass is changed from 0.7 M⊙ to 0.3 M⊙, keeping the other parameters unchanged, and we can see that the microlensing probability increases somewhat.
So far, we have confined our attention to the C − B difference light curve, which has a large amplitude of 0.98 mag and a relatively short run of data due to the small overlap of the B and C light curves when adjusted for time lag. The B − A curve is longer with a smaller amplitude and in the fifth and sixth rows of Table 1, we show the microlensing probabilities from the simulations. To enable a direct comparison, the same values for lens mass and source radius are used as in the third and fourth rows for the C − B curve. As might be expected, the likelihood of microlensing is much greater for both assumed lens masses but, again, it is relatively more probable for lower mass lenses.
5. Discussion
The objective of this paper is to provide an explanation for the strong microlensing events observed in SDSS J1004+4112 for quasar images which appear to lie completely clear of any significant distribution of stars. Firstly, we use deep HST frames in optical and infrared bands to put precise limits on the surface density of stars in the vicinity of the quasar images from the dominant cluster galaxy and from chance superpositions of otherwise undetectable dwarf galaxies. For these measurements, we assume that the cluster dark matter is in the form of smoothly distributed elementary particles and find a negligible probability that the observed microlensing can be attributed to stars. In the second part of the paper, we relax the assumption that dark matter is smoothly distributed and allow for the possibility that it takes the form of compact bodies of around one solar mass. We then make use of computer simulations of the amplification patterns around the microlensed quasar images, based on values for shear and convergence from lens models of the system, to estimate the likelihood that the observed microlensing amplitudes will be seen in simulated light curves. We find that the observed light curves are consistent with microlensing by a dark matter halo made up of compact bodies of around a solar mass.
It is interesting that the early photometric monitoring of SDSS J1004+4112 showed only a moderate microlensing amplitude of around 0.2 mag between images A and B over a three-year period (Fohlmeister et al. 2008), which is perhaps sufficiently small to be accounted for by unidentified systematic effects. However, the measurement of an 822 day time delay for image C (Fohlmeister et al. 2008), along with four more years of photometric monitoring (Fian et al. 2016), revealed a change to this quiescent picture. During this period, image B showed a sharp decrease in brightness by 0.6 mag, while with the overlap between image C and images A and B now at around five years it became clear that image C was being strongly microlensed with an amplitude of around 1.0 mag. Such a large amplitude is rare in any lensed quasar system, but in wide separation systems it is only matched by RXJ 1131−1231 (Hawkins 2020). It is also worth noting that the light curves in Fig. 2 bear a strong qualitative resemblance to light curves from microlensing simulations (for example Kayser et al. 1986).
For most quasar systems where microlensing is observed, the quasar images are produced by a massive galaxy along the line of sight acting as a lens and the stars in this lensing galaxy are held to be responsible for the microlensing. In the case of SDSS J1004+4112, the situation is different as the lens is a small cluster with a central dominant galaxy. The stellar population of this central galaxy is perhaps the most obvious place to look for the source of microlensing, but as we see from Fig. 3, the surface density of stars, or convergence, κ*, has already dropped to a negligible level at a distance of 25 kpc from the cluster centre. As the microlensed images lie at 60 kpc and beyond, it seems fair to conclude that microlensing from the stellar population of the central galaxy can be ruled out beyond any reasonable doubt. This still leaves the possibility of the chance superposition of dwarf cluster galaxies on the microlensed quasar images. We first note that inspection of the deep HST frames in Fig. 4 gives no indication that a dwarf galaxy of any significant size overlaps the microlensed quasar images. However, the scattered light from the quasar images and the lensed host galaxy in the F160W frame make it hard to be sure that very small dwarf galaxies are not coincident with the lines of sight to the microlensed images. Measurement of the integrated optical depth to microlensing gives a conservative estimate of the probability that the quasar images are microlensed by dwarf galaxies, or, indeed, any other stellar structure, and the resulting low value implies that this is very unlikely to be the solution. This suggests that we seek a different route to explain the observed microlensing signal.
If we relax the assumption that the dark matter in the cluster is composed of smoothly distributed particles, the situation changes completely. The total convergence, κ, in the vicinity of the quasar images is around a half, and in the case where the dark matter is in the form of compact bodies, this implies a very large optical depth to microlensing. This is a regime where the probability of microlensing can only be estimated from computer simulations. In Table 1 we present a number of results based on different assumptions for lens mass and source size. To start with, we use values for convergence and shear for images C and B, and the track length and amplitude are from the C − B difference light curve. The first row in Table 1 shows a simulation for a point source and no shear. Neither of these are realistic assumptions, but they are included to help visualize the effects these parameters have on microlensing statistics. For small values of κ and γ, the effect of γ can usually be ignored (Schneider et al. 1992), but for larger values it most often leads to an increase in microlensing probability, as illustrated in Table 1. A more important issue is the effect of the source size. We assumed one lt-day for the quasar disc radius from Fohlmeister et al. (2008), which is close to their value from thin disc theory, but only marginally consistent with the measures of half-light radius from Fian et al. (2016). It can seen from Table 1 that increasing the source size substantially decreases the probability of microlensing, as expected.
The effect of lens mass on microlensing is discussed in Sect. 4, where we point out that in general, decreasing the lens mass results in an increasing probability of microlensing. So far, we have assumed a lens mass of 0.7 M⊙ on the basis that compact bodies forming a dark matter halo would most likely be primordial black holes (Hawkins 2020) and the best estimate of their mass would be 0.7 M⊙ (Byrnes et al. 2018). However, typical values for primordial black hole masses are still very uncertain and so, in the fourth row of Table 1, we show the effect of reducing the lens mass from 0.7 M⊙ to 0.3 M⊙. This roughly doubles the microlensing probability due to the longer projected track of the light curve on the amplification pattern. For the last two rows in Table 1, we repeat the simulations in rows 3 and 4, but for images A and B. The change in the values for κ* and γ do not have much of an effect, but the A − B difference light curve is significantly longer and has a smaller amplitude, which makes microlensing events much more likely.
The objective behind carrying out the microlensing simulations is to establish whether relaxing the assumption that dark matter is smoothly distributed can provide a plausible explanation for the observed large amplitude microlensing in the quasar system. The simulations described in Table 1 cover a range of parameter values. Mostly, the observed microlensing amplitude is well within the expectation from the statistics of the simulations and in no case is it ruled out at the 95% confidence level. From this, we conclude that although the probability of microlensing from the stellar population of the cluster is negligible, if the dark matter is in the form of compact bodies, then the observed microlensing signal is easily explained.
The amplitude of the C − B difference curve is exceptionally large at around one magnitude, which is interestingly close to the A − C curve for RXJ 1131−1231. In this case, the probability of microlensing from the observed stellar population is also negligible (Hawkins 2020), but we note that relaxing the assumption of smoothly distributed dark matter results in microlensing probabilities similar to those in Table 1.
Over the last decade or so, there have been a number of studies designed to put constraints on the mass range of compact bodies which might make up the dark matter. The resulting mass limits have been collated by Carr & Kühnel (2020) and appear to leave little room for dark matter in the form of compact bodies. However, the authors are at pains to point out that the constraints have varying degrees of certainty and all come with caveats. The constraints that are particularly relevant for primordial black holes have been examined by Byrnes et al. (2018), with the overall conclusion that essentially all of the limits rely on assumptions about astrophysical processes or cosmological structures which are hard to verify. More specific to the work in this paper, the surface density of compact objects at the positions of the quasar images in gravitationally lensed systems can be estimated from the statistics of brightness changes due to microlensing. The most recent in a number of studies employing this technique (Mediavilla et al. 2017) use single-epoch measurements of microlensing for a large sample of lensed systems to conclude that compact bodies are most likely to form only around 20% of the total material of the galaxy. This result appears to be inconsistent with the results presented in this paper, but it depends upon a number of assumptions, including the clumpiness of the dark matter halo (Calcino et al. 2018), the mass function of the lenses (Green 2017), and the size of the quasar accretion disc. Perhaps more importantly, the samples used for statistical estimation are largely composed of small separation systems where the quasar images are deeply embedded in the stellar component of the lensing galaxy. In this case, there is no reason to believe that the stellar population cannot account for the observed microlensing, but in samples confined to wide separation systems the probability of microlensing by the stellar population becomes small (Pooley et al. 2012; Hawkins 2020).
6. Conclusions
The main question we ask in this paper is how the large microlensing amplification observed in the images of the quasar system SDSS J1004+4112 can be accounted for, given that the stellar population of the galaxy cluster appears to be negligible in the vicinity of the quasar images. Firstly, we used surface brightness measures from deep HST images in the infrared to quantify the optical depth to microlensing for stars in the dominant cluster galaxy at the positions of the microlensed images. For this measurement, we assumed that the dark matter in the cluster is in the form of smoothly distributed elementary particles. We also investigated the possibility that chance superpositions of dwarf cluster galaxies along the line of sight to the quasar images could result in the observed microlensing. Our conclusion is that based on this assumption, there is a negligible probability of producing the observed microlensing signal.
In the second part of the paper, we relax the assumption that the cluster dark matter is smoothly distributed. Instead, we allow for the possibility that it is in the form of compact bodies of around a solar mass. In this case, the large optical depth to microlensing at the positions of the quasar images means that the likelihood of microlensing can only be estimated from computer simulations of amplification patterns. The values of convergence and shear for the simulations were taken from mass modelling of the lensed system and microlensing probabilities were calculated by projecting the tracks of the light curves onto the amplification patterns and recording the frequency with which the observed amplitude was exceeded. A number of different combinations of input parameters were used to illustrate the effect of source size and lens mass on the probability of microlensing. The results show that in all cases, the observed microlensing amplitudes are consistent with the statistics from the simulated amplification patterns.
In the event that compact bodies make up the dark matter, their identification has been the subject of some speculation. Suitable candidates must be non-baryonic, sufficiently compact to microlens the quasar images, and have masses in a range compatible with the observed microlensing timescales. Primordial black holes are, perhaps, the only known candidates which satisfy these constraints (Hawkins 2020). They thus appear to be the most likely source of the lenses responsible for the microlensing in SDSS J1004+4112, and hence to make up the dominant component of the dark matter of the cluster.
References
- Bernstein, G., Fischer, P., Tysdon, J. A., & Rhee, G. 1997, ApJ, 483, L79 [NASA ADS] [CrossRef] [Google Scholar]
- Byrnes, C. T., Hindmarsh, M., Young, S., & Hawkins, M. R. S. 2018, JCAP, 08, 041 [NASA ADS] [CrossRef] [Google Scholar]
- Calcino, J., Garcia-Bellido, J., & Davis, T. M. 2018, MNRAS, 479, 2889 [NASA ADS] [CrossRef] [Google Scholar]
- Carr, B., & Kühnel, F. 2020, Annu. Rev. Nucl. Part. Sci., 70, 355 [CrossRef] [Google Scholar]
- Chapline, G. F. 1975, Nature, 253, 251 [NASA ADS] [CrossRef] [Google Scholar]
- Fian, C., Mediavilla, E., Hanslmeier, A., et al. 2016, ApJ, 830, 149 [NASA ADS] [CrossRef] [Google Scholar]
- Fohlmeister, J., Kochanek, C. S., Falco, E. E., et al. 2007, ApJ, 662, 62 [NASA ADS] [CrossRef] [Google Scholar]
- Fohlmeister, J., Kochanek, C. S., Falco, E. E., et al. 2008, ApJ, 676, 761 [NASA ADS] [CrossRef] [Google Scholar]
- Green, A. M. 2017, Phys. Rev. D, 96, 043020 [NASA ADS] [CrossRef] [Google Scholar]
- Hawkins, M. R. S. 1993, Nature, 366, 242 [NASA ADS] [CrossRef] [Google Scholar]
- Hawkins, M. R. S. 2020, A&A, 633, A107 [CrossRef] [EDP Sciences] [Google Scholar]
- Inada, N., Oguri, M., Pindor, B., et al. 2003, Nature, 426, 810 [NASA ADS] [CrossRef] [PubMed] [Google Scholar]
- Jedamzik, K. 1997, Phys. Rev. D, 55, 5871 [CrossRef] [Google Scholar]
- Kayser, R., Refsdal, S., & Stabell, R. 1986, A&A, 166, 36 [NASA ADS] [Google Scholar]
- Kofman, L., Kaiser, N., Lee, M. H., & Babul, A. 1997, ApJ, 489, 508 [NASA ADS] [CrossRef] [Google Scholar]
- Mediavilla, E., Muñoz, J. A., Falco, E., et al. 2009, ApJ, 706, 1451 [NASA ADS] [CrossRef] [Google Scholar]
- Mediavilla, E., Jiménez-Vicente, J., Munoõz, J. A., Vives-Arias, H., & Calderón, J. 2017, ApJ, 836, L18 [NASA ADS] [CrossRef] [Google Scholar]
- Motta, V., Mediavilla, E., Falco, E., & Muñoz, J. A. 2012, ApJ, 755, 82 [NASA ADS] [CrossRef] [Google Scholar]
- Poggianti, B. M. 1997, A&AS, 122, 399 [NASA ADS] [CrossRef] [EDP Sciences] [Google Scholar]
- Pooley, D., Rappaport, S., Blackburne, J. A., Schechter, P. L., & Wambsganss, J. 2012, ApJ, 744, 111 [NASA ADS] [CrossRef] [Google Scholar]
- Refsdal, S., & Stabell, R. 1991, A&A, 250, 62 [NASA ADS] [Google Scholar]
- Ross, N. R., Assef, R. J., Kochanek, C. S., et al. 2009, ApJ, 702, 472 [CrossRef] [Google Scholar]
- Schneider, P., Ehlers, J., & Falco, E. E. 1992, Gravitational Lenses (New York: Springer) [Google Scholar]
- Wambsganss, J. 1999, J. Comput. Appl. Math., 109, 353 [NASA ADS] [CrossRef] [Google Scholar]
All Tables
All Figures
|
Fig. 1. Hubble Space Telescope colour image of the lensed quasar SDSS J1004+4112, showing the lensing cluster. The frame is approximately 30 arcsec on a side and north is up, east is to the left. |
| In the text | |
|
Fig. 2. Difference light curves for images A, B, and C of the gravitationally lensed quasar SDSS J1004+4112. The differential variations of the images are attributed to microlensing. The derivation of the zero-point is described in the text. |
| In the text | |
|
Fig. 3. Convergence as a function of radial distance for the lensing cluster J1004+4112. The solid line shows the total convergence, κ, from the lensing model and the filled circles show convergence, κ*, for the stellar population of the lensing cluster. The arrows indicate the positions of the quasar images. |
| In the text | |
|
Fig. 4. Deep HST frames of the area around the lensed quasar images of the cluster J1004+4112. The photometric passbands are F160W (left-hand panel) and F555W (right-hand panel), close to the H and V bands, respectively. The frames are approximately 15 arcsec on a side; north is up, east to the left. The frames illustrate the likelihood of the stellar populations of small cluster galaxies overlapping the quasar images and producing a microlensing signal. The yellow circles define the boundary of the measurement of optical depth to microlensing for the dwarf cluster galaxies. The three bright star-like images outside the outer circle are, from the north, images B, A, and C. |
| In the text | |
|
Fig. 5. Microlensing magnification patterns for a population of 0.7 M⊙ bodies with parameter values of κ* = 0.39, γ = 0.47 and a point source (left hand panel). Right-hand panel: same simulation but for a source of radius one lt-day. Each frame has a side length of eight Einstein radii in the source plane. The yellow lines indicate tracks across the amplification pattern for the lengths of the B − A and C − A light curves in Fig. 2. A net transverse velocity of 600 km s−1 is assumed (Kayser et al. 1986). |
| In the text | |
Current usage metrics show cumulative count of Article Views (full-text article views including HTML views, PDF and ePub downloads, according to the available data) and Abstracts Views on Vision4Press platform.
Data correspond to usage on the plateform after 2015. The current usage metrics is available 48-96 hours after online publication and is updated daily on week days.
Initial download of the metrics may take a while.